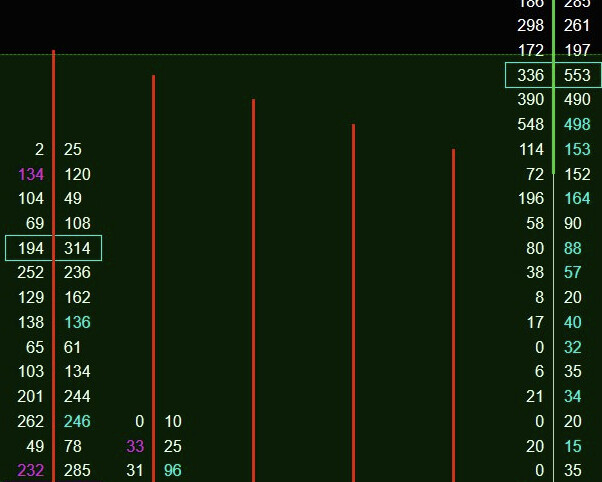
I want to highlight Imbalance cells - which NT currently do but only via a coloured text. I would like to highlight the actual cell itself. Anyone know how i can dothat - or point me in the right direction? Best i can do at the moment is stick a draw tool on the bar which is very unsatisfactory ![]()
1 Like
Not necessarily the cell for the volumetric bars. I’ve done something like that for single prints, but it was kind of a pain because it can change when the user changes the chart size. I have a project here that shows a glowing circle for imbalances. GitHub - WaleeTheRobot/beer-money: A NinjaTrader 8 indicator for order flow analysis with rolling window VWAP and volume profile, diagonal imbalances, and divergent bar detection. Easily identify imbalances on non-footprint charts.
1 Like
i had a look at your other project too. Bit beyond me but great learning opportunity. Give me 6m and I might have worked out how exactly your coding works lol.
Would love to be able to contribute as it is a very worthy project.
1 Like
It’s relatively straightforward with Gemini or ChatGPT. What I always recommend is find an indicator that does close to where you’re going for, for instance what Wally the robot has created, and then you can use ChatGPT/Gemini (I recommend Gemini, less creative) as a tool to manipulate the code. That’s what these AI agents really are good for. They already understand the logic. They already understand how to shape logic, especially within code, and you canyourself simply use that tool to shape exactly what you’re looking for and the same way that you would use a knife to cut and prepare your dishes.
Gemini can shape sharpdx into anything.
The Ninja Trader user app share, is a gold mine. 99.9% of what people want to build is there, and then, however, you can shape it to what you want. And because the code already has the scaffolding and the framework, you can integrate and build incredible things. For instance,
- context aware monitors for your trading environment,
- take features from 2 or 3 different indicators and combine it to give you what you’re looking for rewiring every parameter for the new objective. No memory leaks no issues.
- indicators that can learn and save things via a memory system.…
I’m probably saying too much, but the limit is your imagination.
3 Likes
Hi Maverick
Yes i actually use Claude - I found ChatGPT made so many mistakes and errors i had to correct. Claude is better but still not as good as i would expect it to be. This is one of those things that i have not been able to find or get from the EcoSystem - what is that pic of?
is that in the EcoSystem only i can’t find it in a search?
This is my own tool, however it was a seed that came from a tool in the user app share, and then we shaped into custom tool for my individual approach.
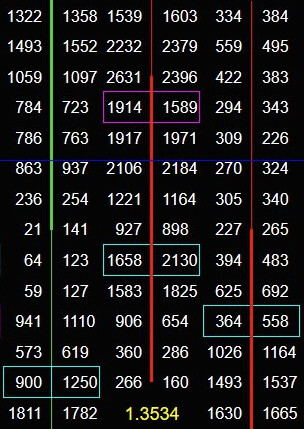
I’ll give you an perhaps anybody else who reads this thread a very useful edge. Asset regards, utilizing artificial intelligence to code. The first step that you wanna do is focus on context building. You can even simply take a screenshot like this, start to communicate with the AI about what it is, what it thinks it is, what do you want it to be, what are the possibilities of this type of tool, and in that way you help the AI tool form context, after me sometimes I’ll just talk to it about what I’m looking for over a few hours or a day or two even a week. And then I would perhaps feed it, and Ninja Trader indicator, simply for it to learn and understand that particular scaffolding the nuts and bolts, and then I will communicate with the AI tool to ref fashion, reform, refact rebirth what I’m looking for based on the context building that we have developed over our conversation. The possibilities are endless. I want you to imagine indicators that can learn that utilize memory systems. Again, your imagination is the only limit.
Below is a simple tool that processes time and sales data, with context awareness. It can be used independently. however it also plugs into another indicator in order to feed it raw information. That other indicator is a prediction engine that use 1400 point context key to ‘learn’ price (Some bigger firms may have 1 billion keys and with so many keys, the indicator needs data to learn. My indicator may take a month fill in the 1400 context keys with probable behviours forward learning, The big guys use historical data to speed up their learning systems) behavior when it hits a line, a moving average, other indicators that retail uses. It learns it utilizing bayesian priors and other calculations.
I say all this to inspire… but really to convey that your imagination is the only limit with these tools.
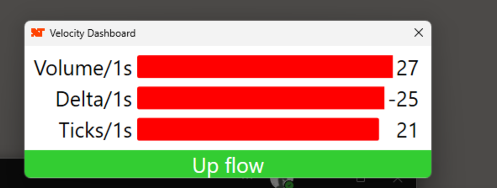
(This Velocity Dashboard, was the offspring of ‘Pace of Tape Indicator’ found in the user app share)
1 Like
Very nice but I am sure i have seen some code grabbing the ‘Ladder’ around a volumetric bar somewhere. I can get close using DateTime half bar structures but still not quite right - so i just want the method or render that can give me the box if anyone has it otherwise like you i will have to spend hours with Claude ![]()
I’d say spend the time with Claude, it’ll learn about what you like and the process would be easier for future indicator builds you put together.
1 Like
Ok i have a basic working model - large no of tricky issues with ticks per level. Will post once i get it working properly. I have had to compromise a little on the rendering. Using getbarpaintwidth was not the solution ironically. Well currently anyway. ChatGpT was great using it’s latest model but when i got bumped down it was worse than useless. Claude was ok but again you really have to hold it’s hand and it gets very stuck in a linear fashion trying to solve things. So that’s good news for the human race - I can still provide some of the original thought to push it in the right direction!!
This indicator (https://ninjatraderecosystem.com/user-app-share-download/legtolegdeltaprofile-rotation-based-delta-volume-profile/) uses tick level data (ticks per level) and requires tick replay. It has the engine, you can extract that specific logic and integrate into your build.
thanks. I did my own thing and it’s finished now. Have made it an indicator and uploaded to the EcoSystem. Just waiting for it to be approved and then i will post a link here. Took a LONG time to encode everything but the result works and functions very efficiently.
3 Likes
Ask you favorite AI agent. If you don’t have one, I highly recommend you find one. Copilot does OK for most things. Claude is excellent for everything else. I use both and you wouldn’t believe the things I’m able to do now.
3 Likes
yes i use claude a lot and sometimes ChatGPT which is ok on the latest one but prior iterations were genuinely awful. What is really interesting about this project is watching bid/ask values go down when your live - i know nt would say that’s not possible but i have seen it dozens of times. I thought i had a bug in my code but it’s picking things up I never knew were there lol. Edit it seems to be that if you are on more than 1 tick per level it has to shuffle things when a new level forms ie re establish where the bid/ask volume should actually go.
Are you able to create the flux capacitator yet? ![]()
If you’re using a 1-tick data series to get your bids and offers, I too would say that’s impossible. And if you’re not on a 1-tick data series then I have no idea what would happen.
I feel the force is strong in this one…
1 Like
ok it’s done and uploaded to the user app section. I will post the link here once it’s approved. Interesting exercise - learnt a lot about how AI works ( or doesn’t?). Its still in it’s teenage years i would say but of course it will develop exponentially. Skynet soon …
2 Likes
Small update - found a small but really irritating bug that took ages to resolve. If NinjaTrader monitor these forums PLEASE expose the grid that volumetric bars place their values on - would have made this so much easier. Good news though ; while doing that I upgraded the code to run real time and do diagonal as well as horizontal imbalances. So loss and a win win.
3 Likes