I can’t seem to find indicators or drawn lines, vwap, settlement, day high/low, etc, with text labels identifying each level with the corresponding name, vwap etc. Being partially color blind trying to identify levels based solely on colors won’t work. Am I missing on where to find these?
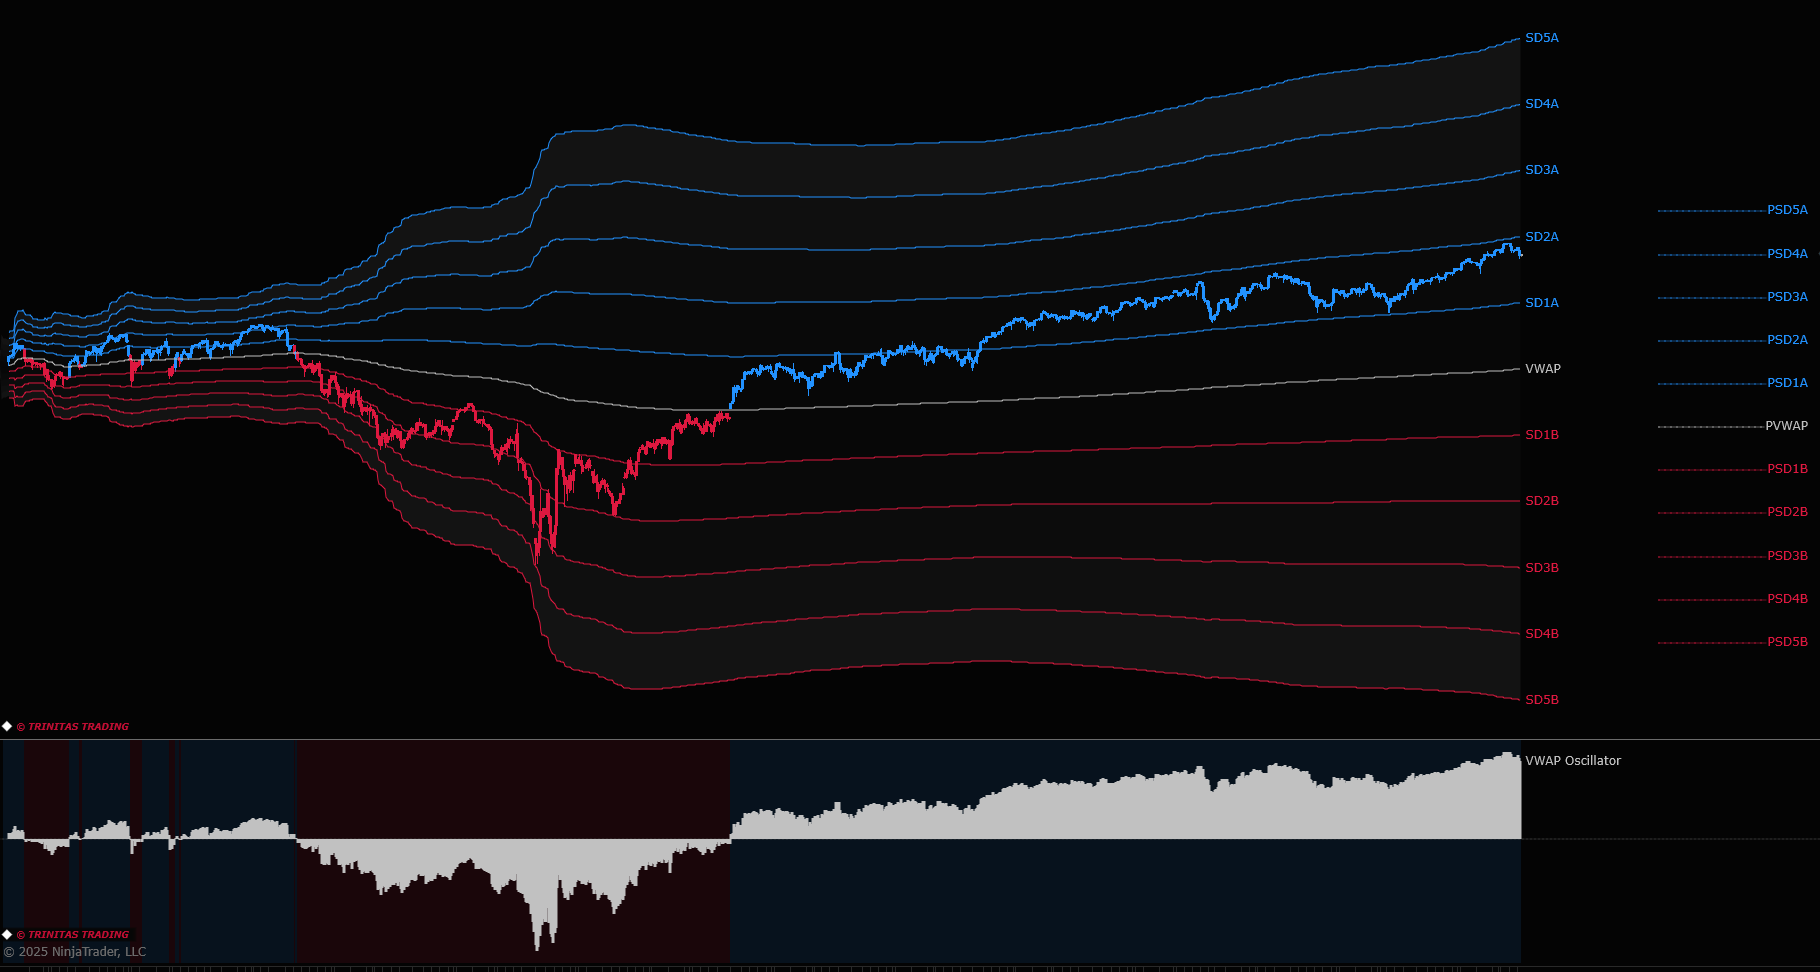
All of our indicators that have plots come with very flexible and configurable plot labels and plot style options. For example, regular plots that show developing values vs edge plots that show only most recent values to avoid clutter on the chart. You can have plot labels that include plot name and value, change plot style, rename plots, etc. But this is built into the functionality of our indicators.
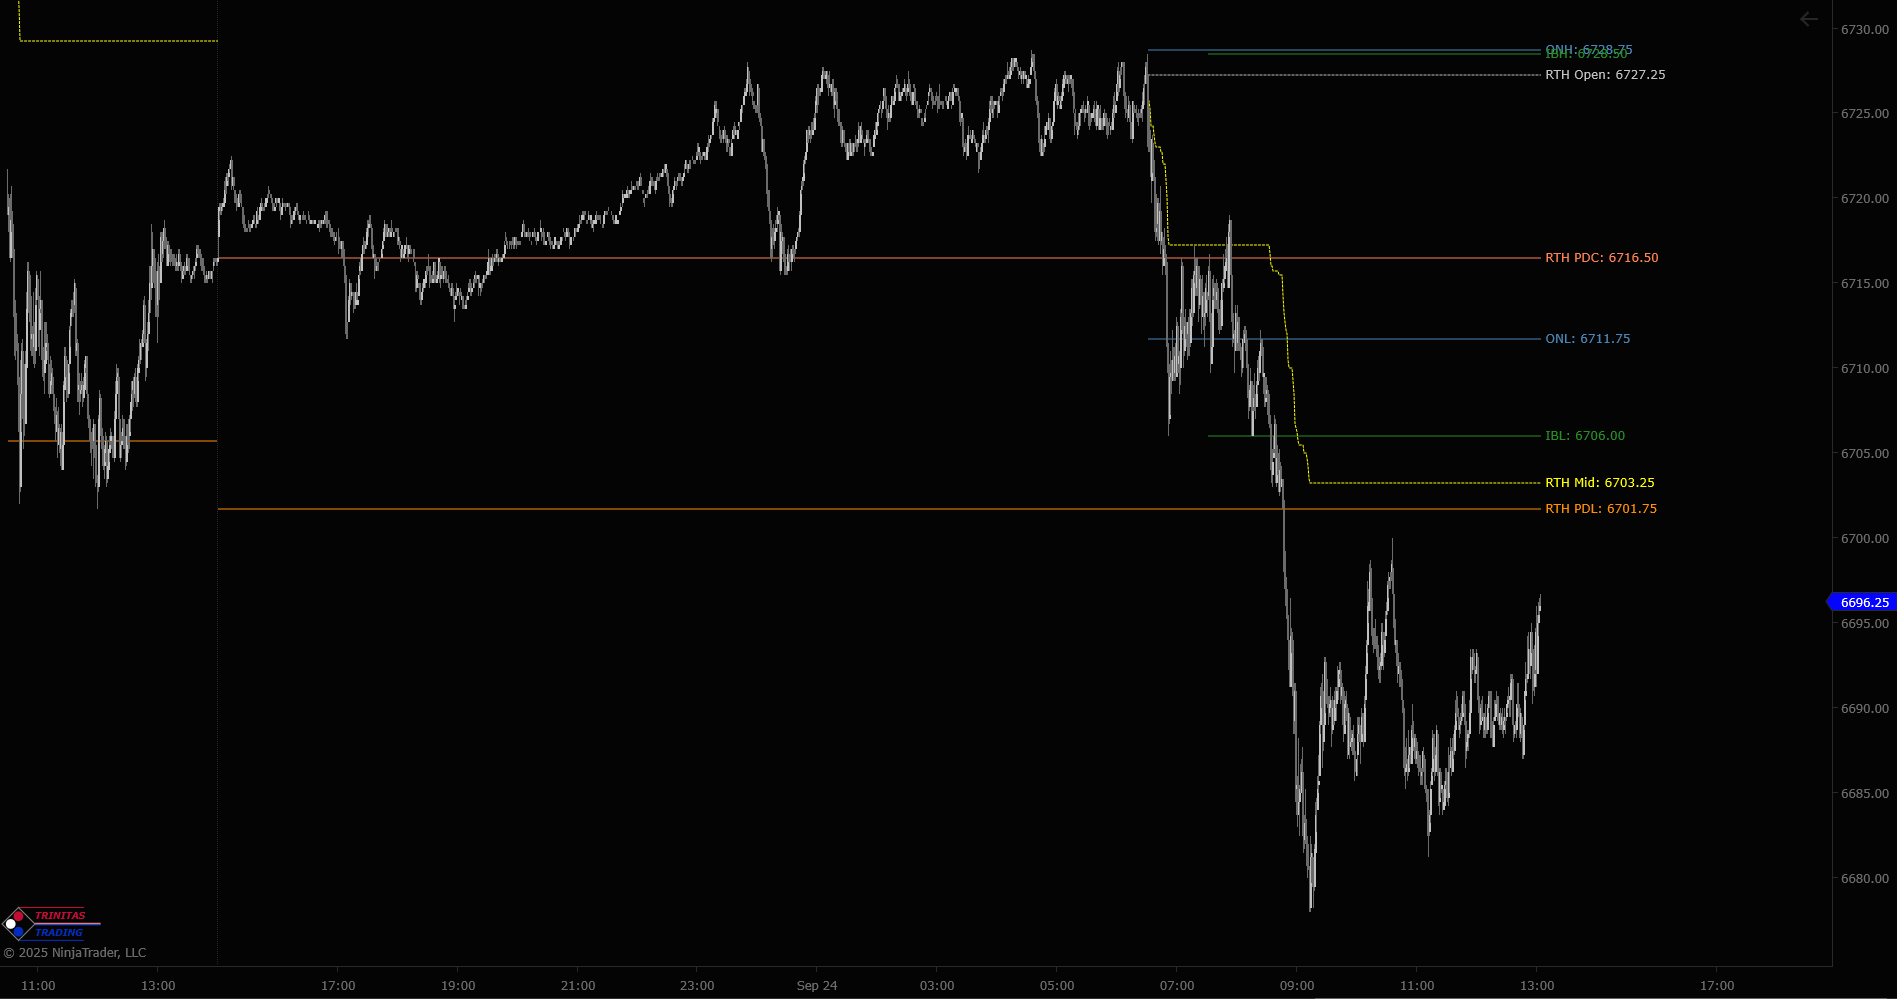
If you’re looking for market structure type levels like daily high/low/mid, prior day high/low/mid, opening range, initial balance, overnight range, current and prior day value area, VWAP, etc, feel free to take a look at the Products page on the link on my profile. We also offer a free MGI package that might have what you’re looking for.
Feel free to direct message me if you have any questions about the specifics.
There are extensive user guides that go through every available functionality.
Support > User Guide
Feel free to send your questions to the support email available in indicator properties.
I don’t want to turn this forum into my support line