I developed a simple breakout strategy based on experience. Figures look decent to me, but i am in doubt whether to optimize with the risk of curvefitting or keep it as it is. Can you guys take a look at my backtest results and give me some advice?
I need more info to analyze it correctly:
Account size?
What are you trading? There are different commissions and different tick values.
Number of contracts per trade? Changing size by adding profits?
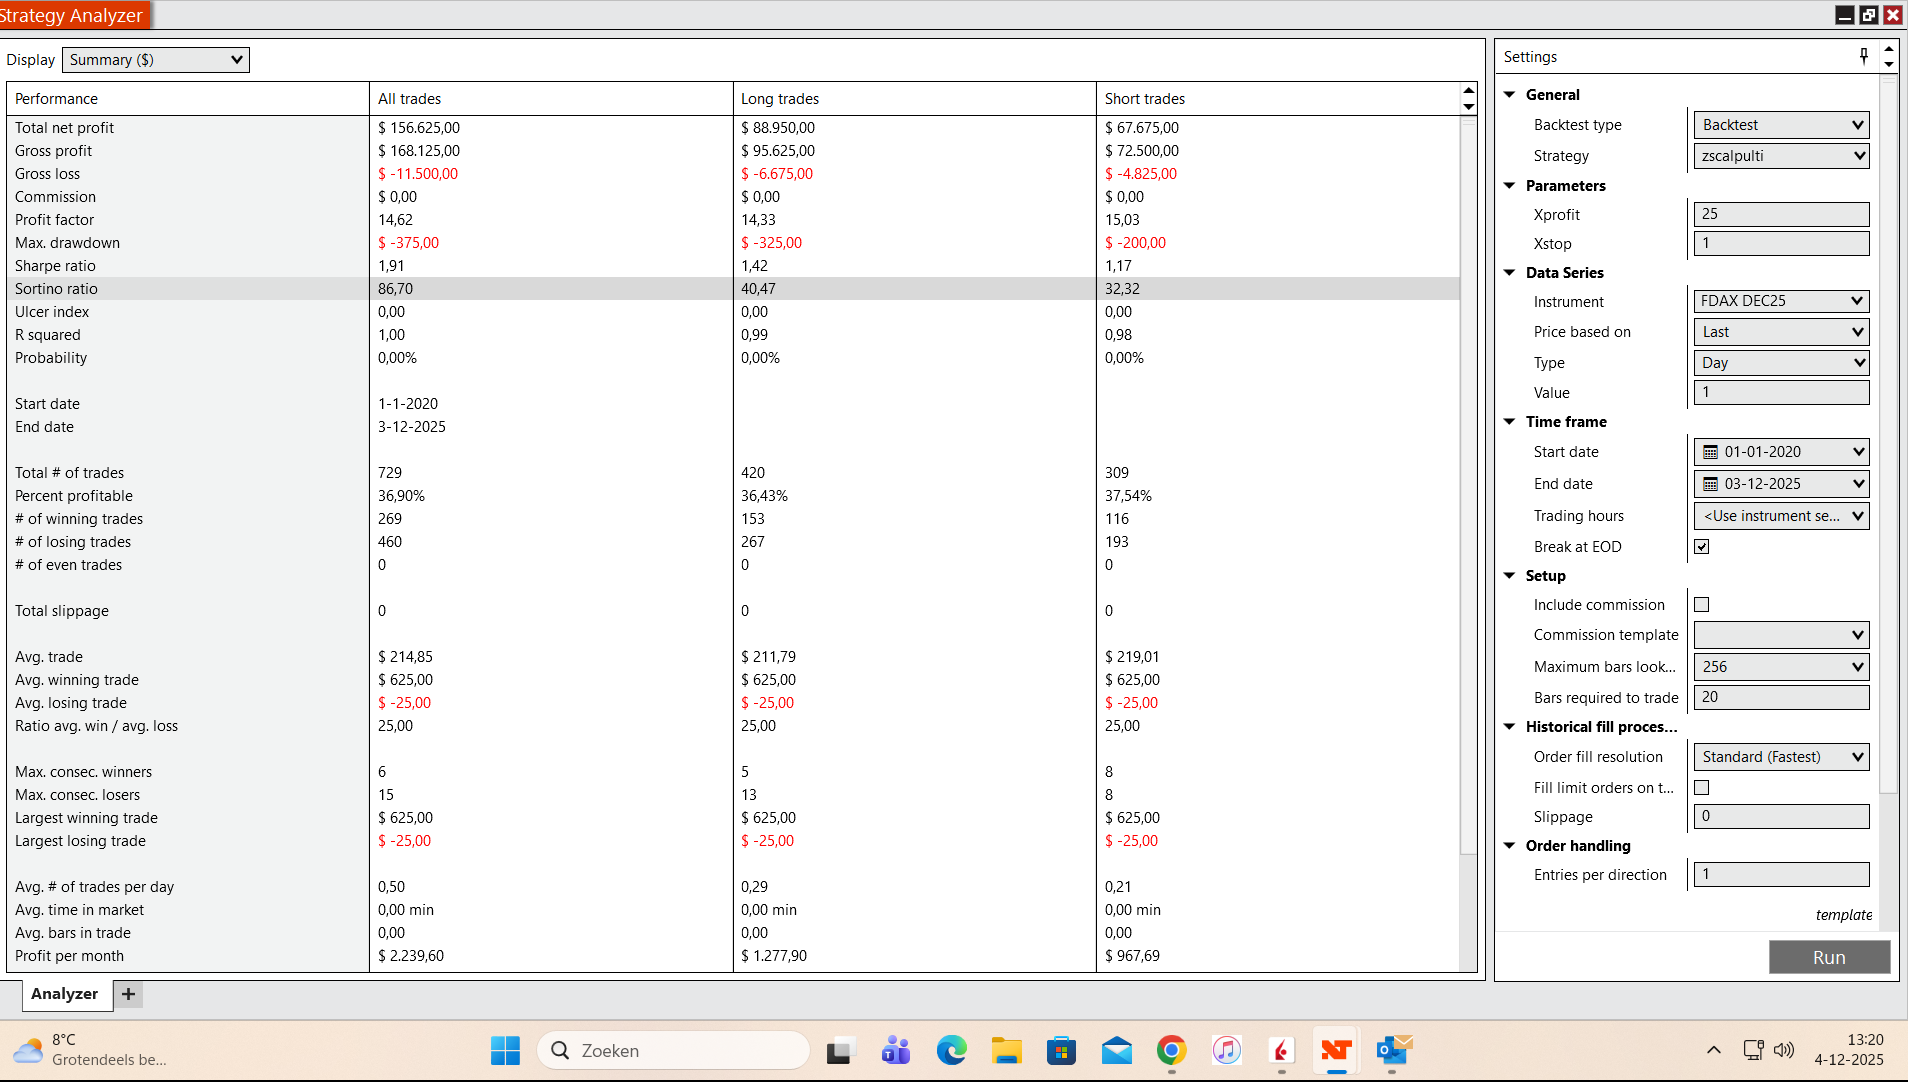
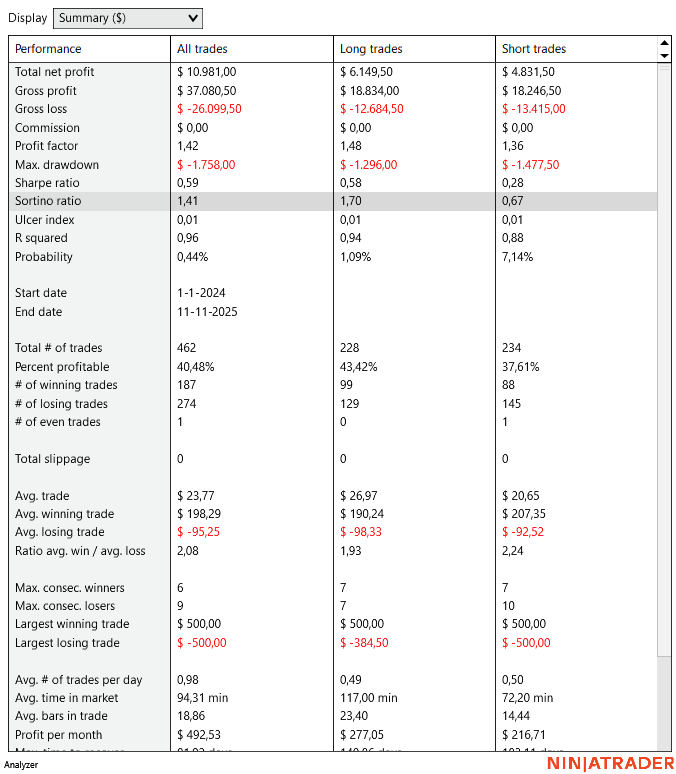
This are the stats of trading 1 MNQ future. No changing of size. (Profit factor etc MES en FDAX are more or less the same. )
- Add some slippage and commission and see how that affects your average trade. If this is MNQ it should only reduce by $7-8.
- You have a NP/MDD ratio of 6.24 over a period of 22 months. This is pretty high and strategies in this range are more likely to be overfit. But it’s not terrible. You might want to test it on several months of out-of-sample data or let it incubate for a while to see if it holds up.
1 Like
Thx . I added an exit at the end of the day , so each day i start new and this also improved the stats. Since I already traded a bit this way I am going to trade it for real for a while. See how the stats will be and how comfortable i feel following the signals.
Does the backtest ever translate positively to the live market. The impression i get is that both the strategy analyser and market replay provided by Ninjatrader are total garbage…I guess if you are looking at movement of 100 ticks it might give some meaningful simulation, but even for movements of 20 30 ticks I saw the market replay was totally inaccurate, and I guess strategy analyser is way worse than market replay…but I am a newbie so maybe I am wrong.
Maybe that depends on the historical data you are getting. My impression is that data is correct, but you have tot take in consideration that with futures on roll dates there is an adjustment at expiration. But maybe experts here can reply better then me.
1 Like
I have myself seen huge difference between market replay and live, and I think it is documented here - https://ninjatrader.com/support/helpGuides/nt8/NT%20HelpGuide%20English.html?discrepancies_real-time_vs_bac.htm , but there are other documents which explain how market replay simulates movement within the bar, it is just a random simulation not the replication of live price movement.
Ok , I guess you experience problems with intrabar situations. I use 5 minute data and trade on the close. I see my real trades this weak are the same as the trades i see when i do a backtest over this week.
1 Like
To add on to vipinb and be more specific… https://ninjatrader.com/support/helpGuides/nt8/NT%20HelpGuide%20English.html?understanding_historical_fill_.htm
I always prefer to do some tests personally before accepting what people post here.
I use playback with historical data already for many years intensively, and will share my findings.
But first I will explain how I use it:
- I “reload all data” for minute charts, and seconds charts to have the most recent data too
- I study my charts manually, and write down all the entries and exits
- I then disconnect “My Ninjatrader” and connect to “playback”
- I then study my charts and write down all the entries and exits again to compare them with the charts in “connected mode”. They are identical. All indicators give everywhere the same values. So data for connected or playback are IDENTICAL.
- I see that all entries and all exits of my trades are exactly the same
- I then use the playback mode to find the exact price at which it triggers entries and exits in the seconds timeframe as most signals happen within 1 bar and you only now that the exact price is somewhere in that bar. I want maximum accuracy so I check the seconds charts
As I was worried from start (years ago) that the data would be different (as I read everwhere) I did then already a test and saw that all data (open, high, low and close) were always IDENTICAL.
To be sure I did a few minutes ago the same test in NQ 1 minute timeframe for the last two days. I found 14,208 prices in connected mode and also 14,208 prices in playback mode. ALL this data for the whole period is IDENTICAL.
I first used, years ago, replay data, but then I had to download it day by day, and this for each instrument that I needed. It was HUGELY time consuming.
And my fills are more accurate then any other solution on NT8. But you always depend from the REAL fills in REAL trades, so my accuracy is still not 100%, but I can live with that.
2 Likes
I am not a salesman but the Market replay downloader in the Add - on suite of theintentionaltrader is quite popular for downloading years of market replay data with 1 click…glad the system is working for you…i run my strategy in Calculate.OnEachTick and yet the winners and loosers of my strategy on live are totally different from winners and loosers that i get from my strategy when running it on market replay. the thing is the intentionaltrader indicators i am using run on tick data so my strategy does not open trades only on close of bar but at any point of time it can open a trade and so for me I need the movement of ticks within the 1 minute bar to be exactly the same as they happened on live and as the document provided by Walee above shows that is just not the case with Ninjatrader market replay.
I would be happy to be told that I need to use a certain workflow to correct this behaviour, i am a newbie and dont know much about anything…but so far what I have understood is that to get the exact tick by tick replay one has to either record the market themselves using the recorder (and even then it is probably not perfect because it is just a snapshot taken every 1 second), or actually the only way to get perfect historical data is to purchase it online.
Like I said I will be extremely happy if someone can show that my understanding is total rubbish, I mean i am only here to better my understanding of ninjatrader.
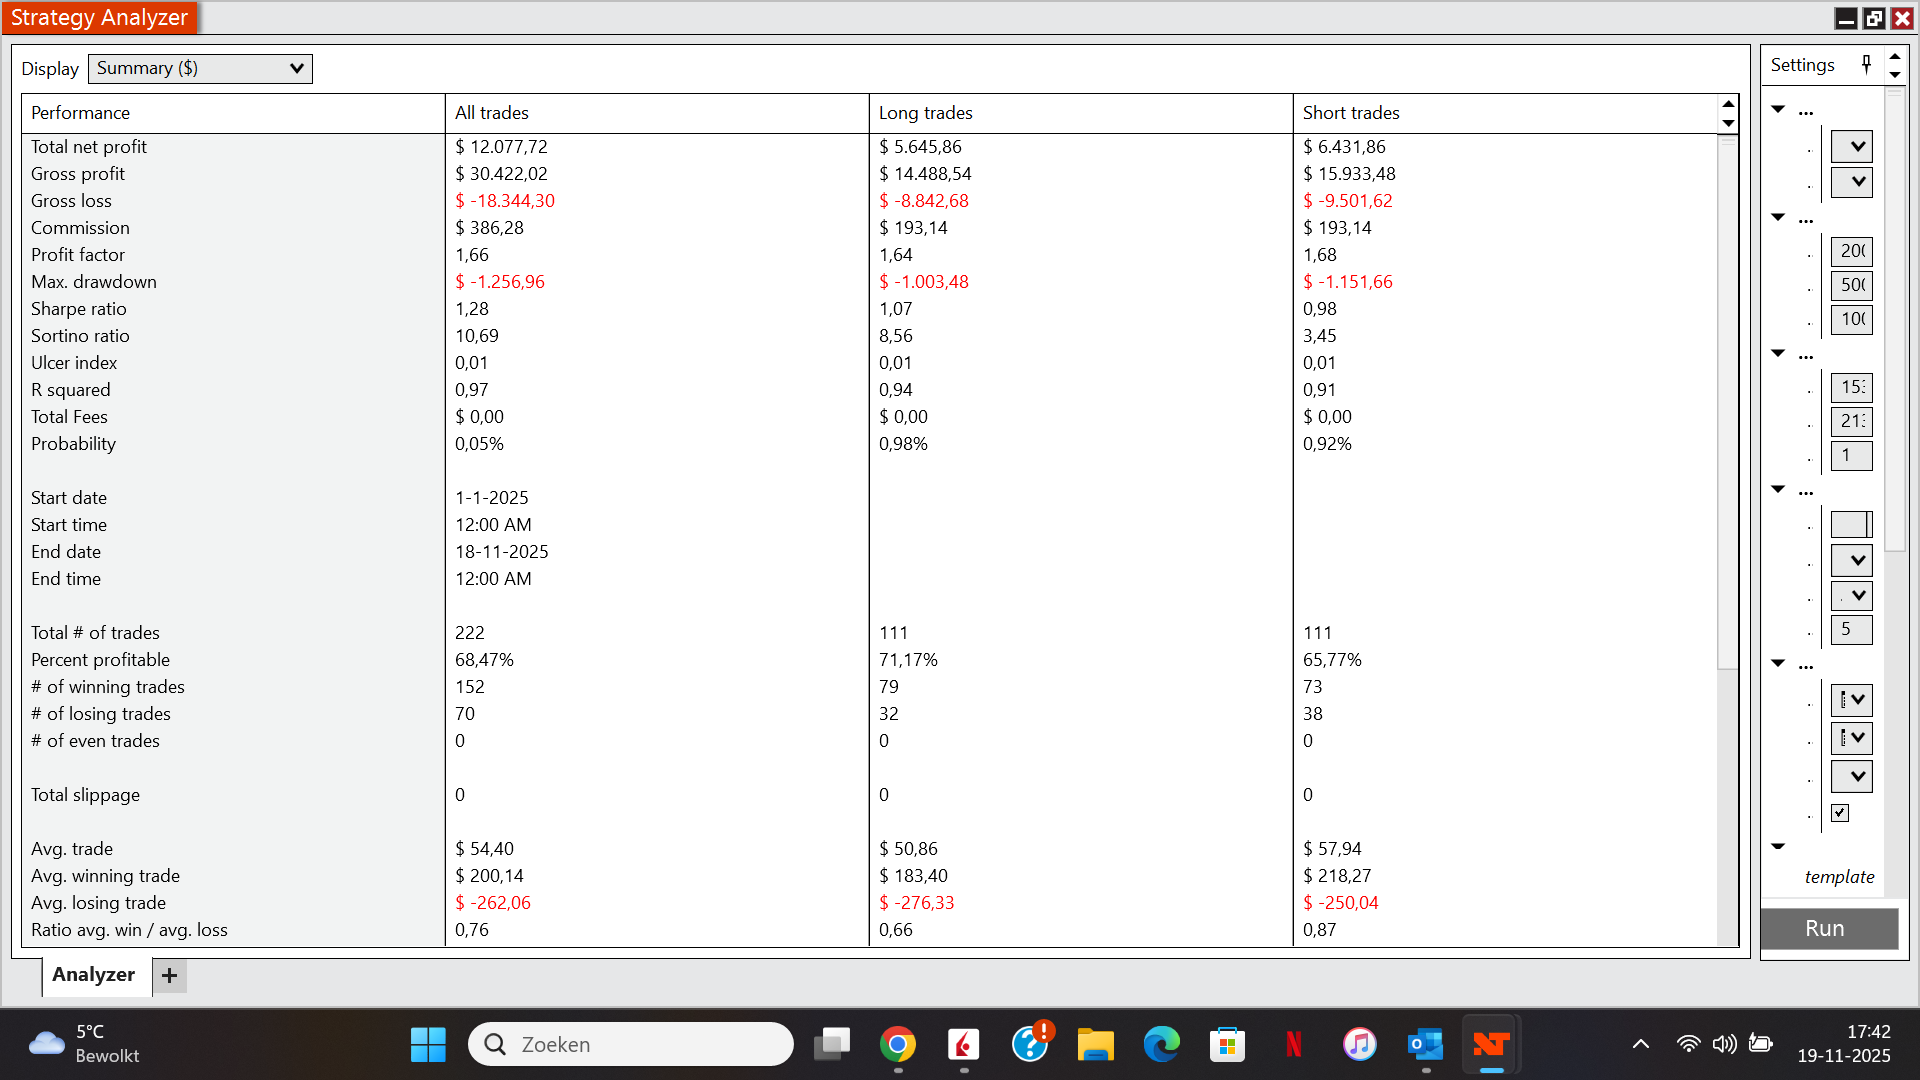
I adjusted things this weekend a bit. I applied a little martingale to the strategy. When a trade is negative i double down and i do this max 2 times. So max position is 4 lots. This give a much smoother curve and of course higher profit factor. Do more people do that?
My only suggestion is either implement 1-tick intra-bar granularity or run this through playback.
3 Likes
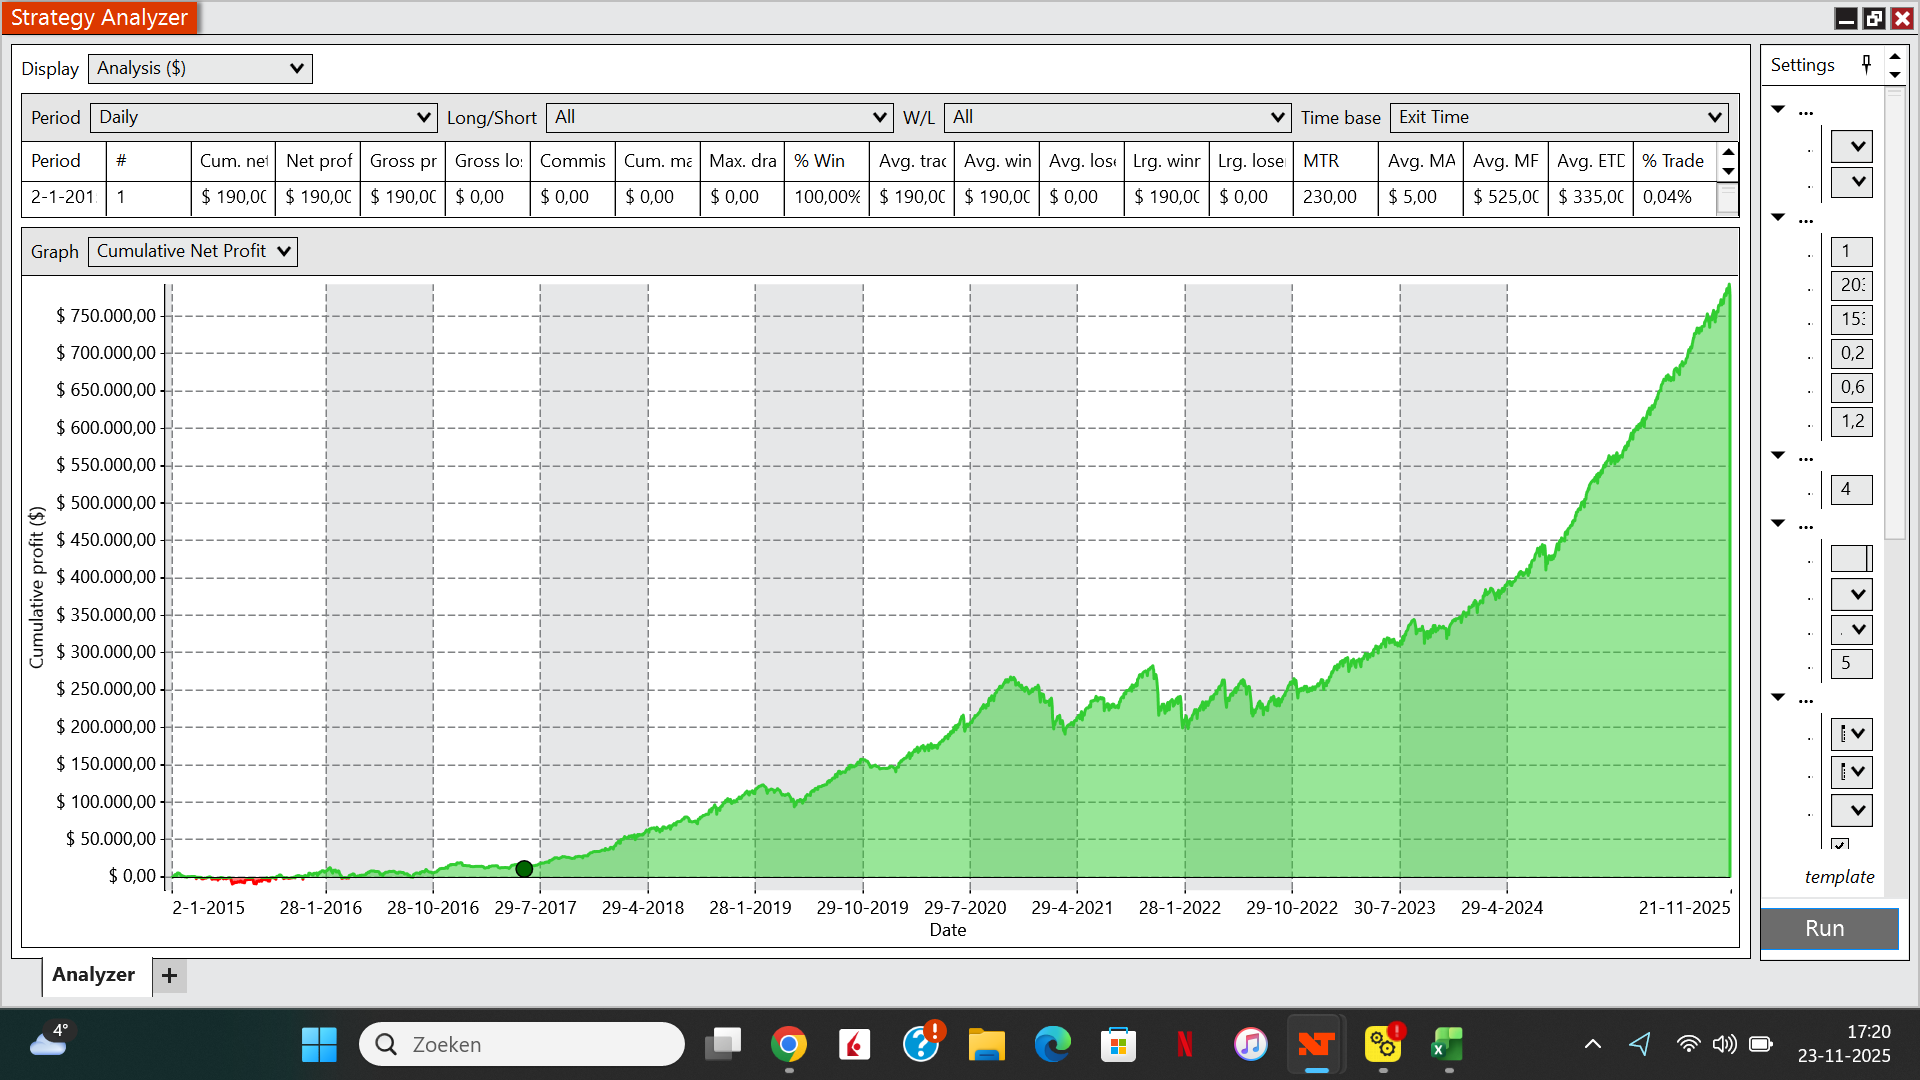
I started the strategy ans so far it does what is should do.
However in the mean time I started optimizing and getting higher profit factors. I found out that in backtesting there are some issues. When I make a simple strategy on daydata with two variables and I put the stoploss at 1 tick and profit factor a lot higher I get insane results, which of course is not realistic. When i look at trades I see that losing trades in the backtest are all stopped at a 1 point loss, while in realtime this is impossible. Something to take in consideration while backtesting…