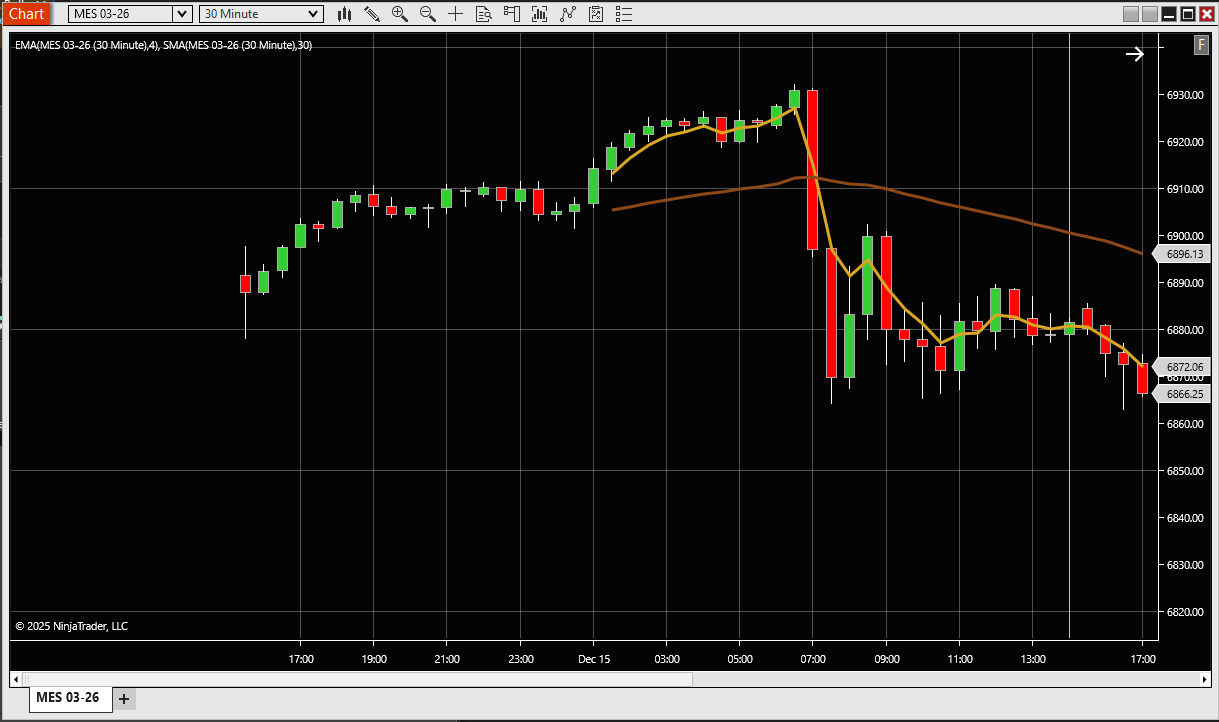
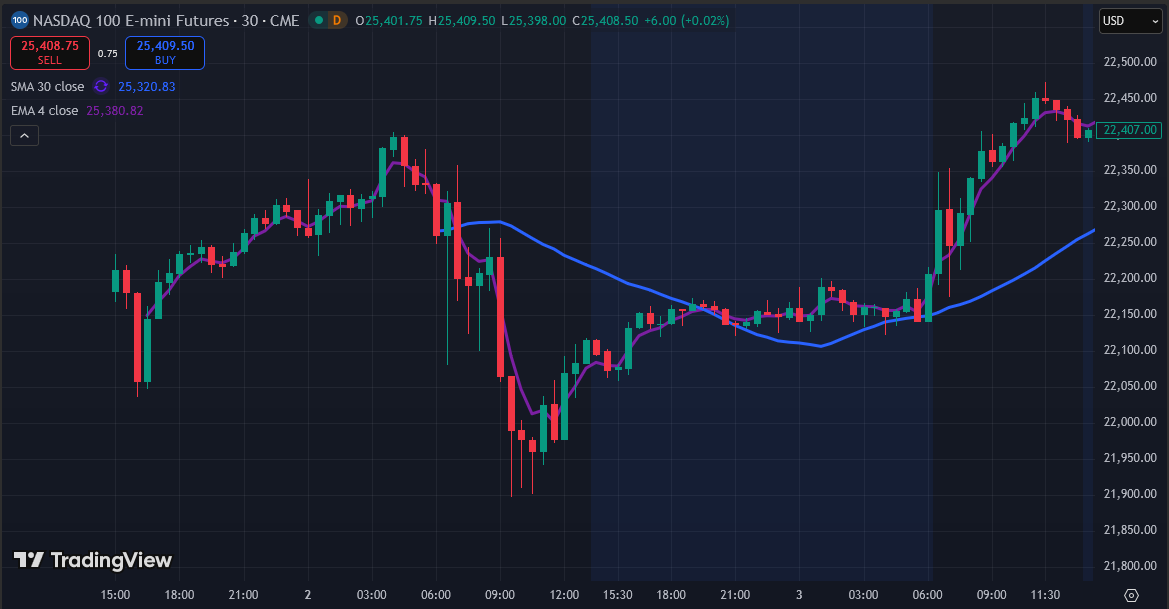
I’m noticing some strange behavior with the builtin SMA/EMA indicators. I have a chart with a SMA(30) and an EMA(4) yet, for some reason, both indicators start plotting on bar 21. When I test the same setup on TradingView the lines start where you would expect. Has anyone else seen this behavior, or do I have something broken in my install? I’m using v8.1.5.2
Thanks for taking a look. At least I’m not the only one seeing this. I tried with both 1 day and 5 days of data and I still get the weird behavior. I’ve looked at the SMA/EMA code files and they seems to be calculating in a non standard way. They both start generating values from the very first bar (if you show the Data Box you can see they have values). I’m thinking 20 must be the default BarsRequiredToPlot value. Feels like an oversight to not be setting that to the average period. Thanks again!
I always followed the logic: for a 30 bars calculation of an indicator, you need at least 30 bars. If you have less bars the calculation cannot be correct as you miss real data for a number of bars.
I always check that the indicators that I use, are already running a number of bars before the bars from where on I use that indicator.
Well, the reason they make it programmatically available rather than enforced is that often indicators like SMA or EMA have behaviors that aren’t strictly a function of their length.
For instance, many SMAs are set to have a value from the first bar, with their length included gradually increasing until “length” bars when the full length is used. And EMAs include, at least to some extent, every bar they’ve seen on the chart, so having a 50 bar EMA start exactly on bar 50 isn’t really the right thing to do. Often, in these sorts of cases, it’s common to see the developer use a number of bars to stabilize the calculation such as 30 that doesn’t really vary by its “length” which is really just a notion anyway since it includes some tiny faction of the value of all of the bars going all the way back to the beginning. For these and similar reasons, NT probably elected to make it a configurable adjustment, rather than doing what, for instance, TradeStation did, which was to simply enforce that it doesn’t plot until the number of bars it loops back through are available.
Thanks for your insights Bruce. It’s true that NT made the choice to use the calculation method you described. I would argue that not displaying a value for a 50 EMA until the 50’th bar is a more rigorous approach, but that’s just my opinion. What I find most strange is that given the choice NT made, why don’t they either start plotting at bar 1, or wait until bar 50? There are values from bar 1, so why not plot them? In my example, one average starts plotting early, and one starts very late. I would think their implementation should explicitly set BarsRequiredToPlot to either 1 (since they have values calculated) or to the period value (to align with the user’s settings). Starting both at bar 20 feels silly, and why I think it’s an oversight on their part. Just my $0.02