Separating structure from orderflow, monitoring both independently before entry

Something I’ve been thinking about.

Most strategies I’ve seen evaluate orderflow at a fixed moment. The entry signal fires, you check the orderflow, pass or fail, done. One shot.

But thats not how a discretionary trader works. A discretionary trader watches the structure develop, the extension, the pullback, the reclaim, and separately watches the orderflow develop. They dont require both to align on one specific tick. They wait for convergence.

So the question is, has anyone tried to build a system that monitors these two things independently?

Structure: is price doing what I expect? Pullback into a zone, reclaim off the extreme, bounded by invalidation.

Regarding orderflw, is the opposing side failing? delta consumption, shifts, absorption flips.

The system watches both independently. When both confirm, not necessarily on the same tick, it enters.

The nuance is that orderflow often confirms after structure does. Price reclaims but the orderflow is still messy. 100 ticks later the trapped sides delta gets consumed and delta relationship flips. By then a single shot system already consumed the setup.

Curious if anyone has explored decoupling structure and orderflow into two independant monitors that converge, rather than evaluating everything at one arbitrary moment.
1 Like

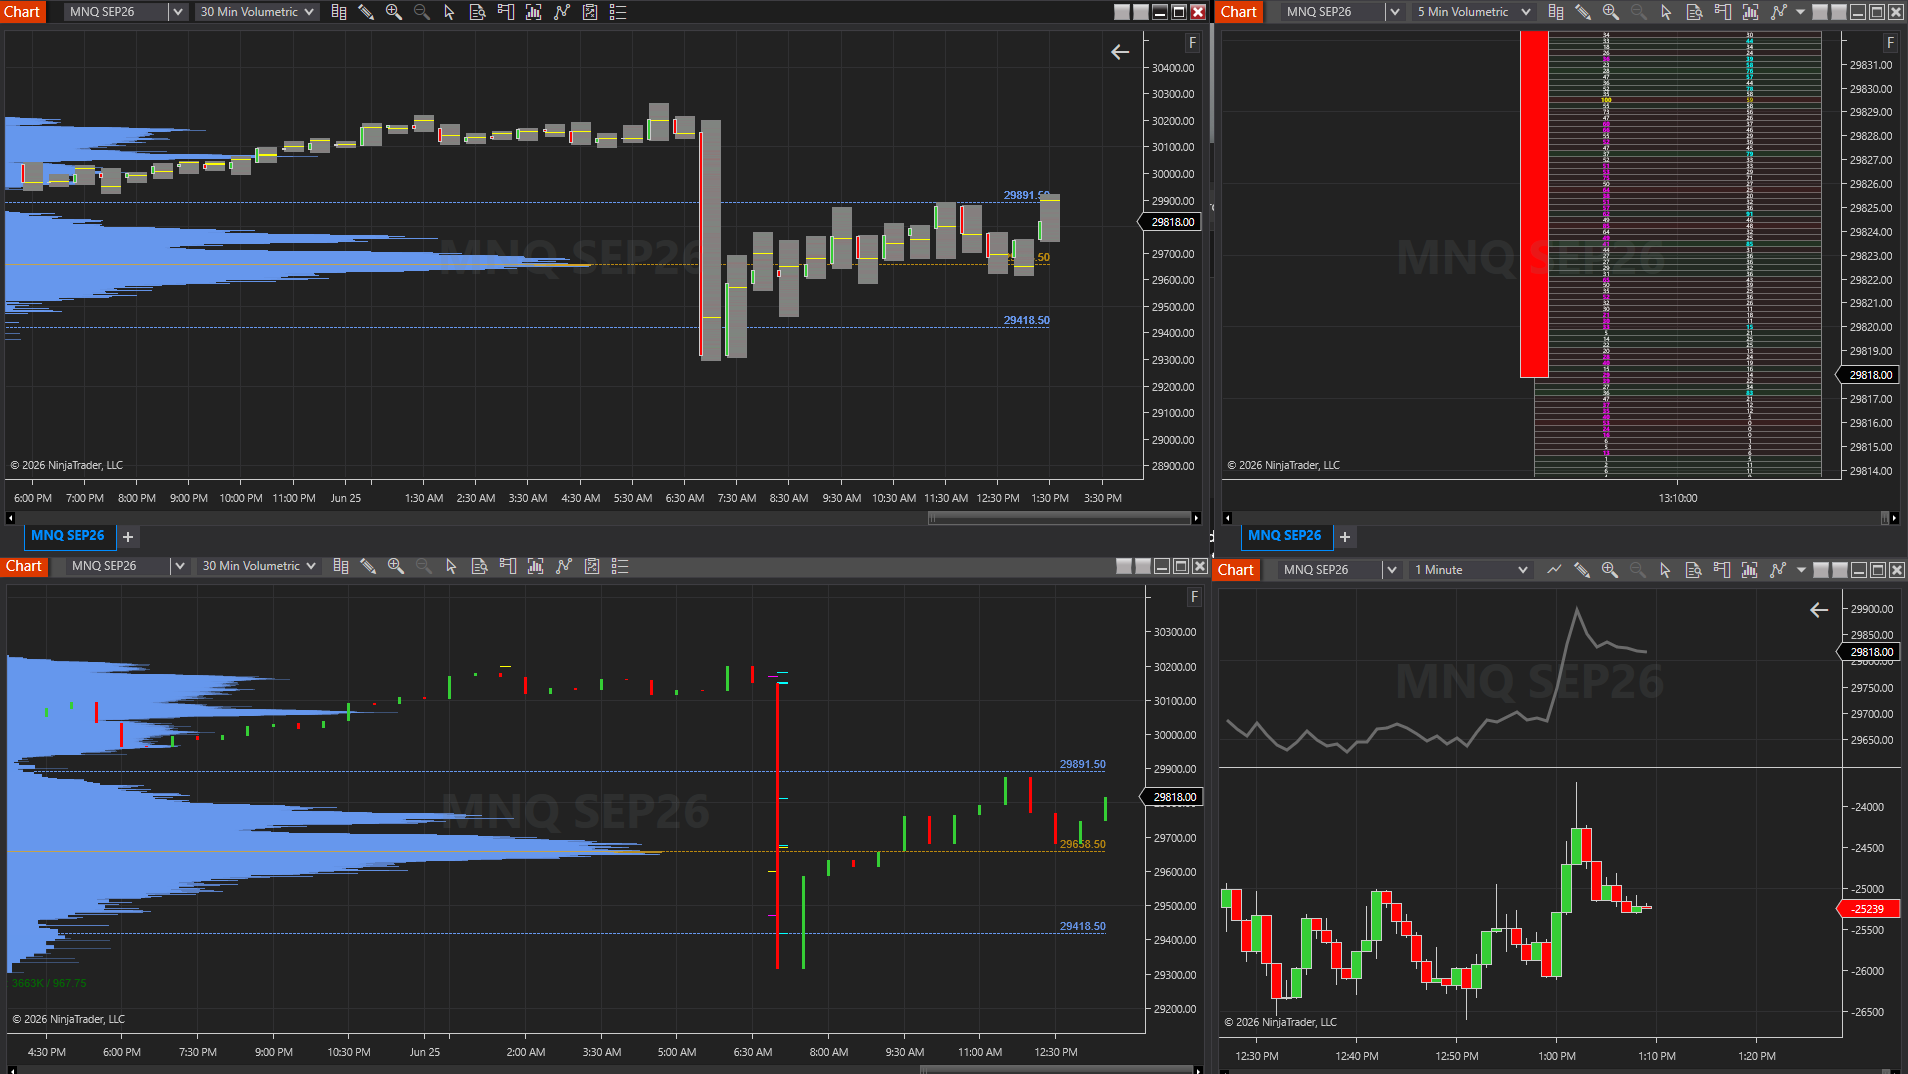
are you referring to the 30m-30m-1m-and 1mdelta/price

irrespective of the chart. We could even use a line chart only. We’d first define what a structure is, the one we’re looking for, and we’d define the characteristic of the orderflow that’s be amenable to our objevtive, whether price will move one way or the other.

sorry I was wrong, I meant 30-30-5-1

That 30 minute bar that you have at 6:30 AM, had a structure that you wouldn’t see because you’re using time based charts, so if you were using like a tick chart or volume chart (and based on your settings), you would see a structure. That whole 30 minute down bar would be a downtrend structure, and within that structure, you would be looking at particular relationships, and signatures inherent in the order flow.

I presume its possible with time base charts, but that’s a different perspective from what I’m used to

1 Like

Would this work?

Instead of building candles only from time, what if the system only took a new snapshot when something important happened in the order book?

For example, a normal candle gives us information from open to close. Once the candle closes, we have one completed snapshot of that time period.

But what if time is not the best trigger?

What if the snapshot was triggered only by meaningful liquidity changes, such as a wall larger than 100 contracts appearing, a bid increasing by 50 contracts, an ask disappearing, book imbalance changing by 200 contracts, the best bid or ask moving, or liquidity shifting several price levels?

Would that remove a lot of noise?

Instead of recording every small depth update, the system would ignore weak changes and only save the moments where liquidity actually changed enough to matter.

So the question is

Would an eventdriven footprint work better than a normal time based footprint?

The goal would be to focus less on candles and more on liquidity behavior.

The chart would not ask, What happened during this 30 second bar

It would ask, Did the order book change enough to create a useful signal?

That way, the system could focus on major liquidity events like stacking, pulling, absorption, walls, liquidity shifts, and price moving away from large orders. sorry random thought lol

For the long time I only traded and analyzed marked based on non time based charts. That was a mistake as time is a very large component of supply and demand.

1 Like

It’d have to use relationships, for instansce ‘x>v’ by x magnitude, using the greater than, less than, etc. I’d be looking at the relationship of the elements because a definite value isn’t going be conclusive.

1 Like

Any type of chart would work it’s just what your perspective is better able to work with. For instance, the 30 minute down bar that you had in your Screenshot, if you looked at it via a one minute chart, you would see a downtrend structure composed of 30 one minute bars.

1 Like

This is the key!

A time base chart or a price base chart or base chart or volume base chart, it’s just all a canvas within which price moves. Those who trade the auction are looking at participation at various price levels, add price goes up and down, up and down, so if you’re watching a chart, you’re looking at those points where volume is concentrated, and where volume is less so, and there are relationships. And you can bring that down from the day down to a 30 minute chart or a five point chart or a 300 tick chart,. The chart is just a canvas within which price moves up and down and accumulates transactions.

1 Like

don’t judge me, it’s still not done lol i still need to finish the headers and i still need to test the logic I mention or find a good logic, and that should make its completion,

With this, you may ask one of the AI intelligence tools, to consider the possible relationships that you can start to look at and surface based on first principles. And I stress for principles because that particular path will help the system surface relationships that you can look at yourself and say OK yes that makes sense if we stack this together or if we see a number of these relationships within a span of price or a span of time that is saying something.

There are other relationships it can surface that are not first principles, but you don’t want those just yet, because its black box, you wanna look at the ones based on first principles because those would allow your mind to grasp it and then infer upon it, then later on start surfacing black box relationships.

And by black box relationships, I mean relationships that are not intuitive.

1 Like

I normally run these signals through a quantitative pipeline. Collect multiple data sources, test which ones provide the strongest predictive State, select the best performing source or feature set, and then run that through the full model for deeper analysis and execution testing. wow the word Black Box reminds me of war lol, its true born nature lol, I do feel like adding some NLP into this, I think I will add a tab to add some NLP for Analysis

Use this: https://ninjatraderecosystem.com/user-app-share-download/volumetricdata/

to expose the volumentric data form the nt volumetric offering.

It gave me some ideas for developering other primitives.

Its a helpful starting tool

1 Like

There’s another one you can find in the space space built by nt start that dumps data points from your charts, every indicator, chart, basicaly everything on your chart, it’ll dump the datapoint to an excl or csv. It makes for a good data on which to base analysis on.

Might be helpful to ya

1 Like

There is only 1 correct way to trade other methods are guessing. this is how the exchange works.

Nice really helpful information ,

Here’s the other one I mentioned

1 Like