Double click in measure mode, flips to drag.
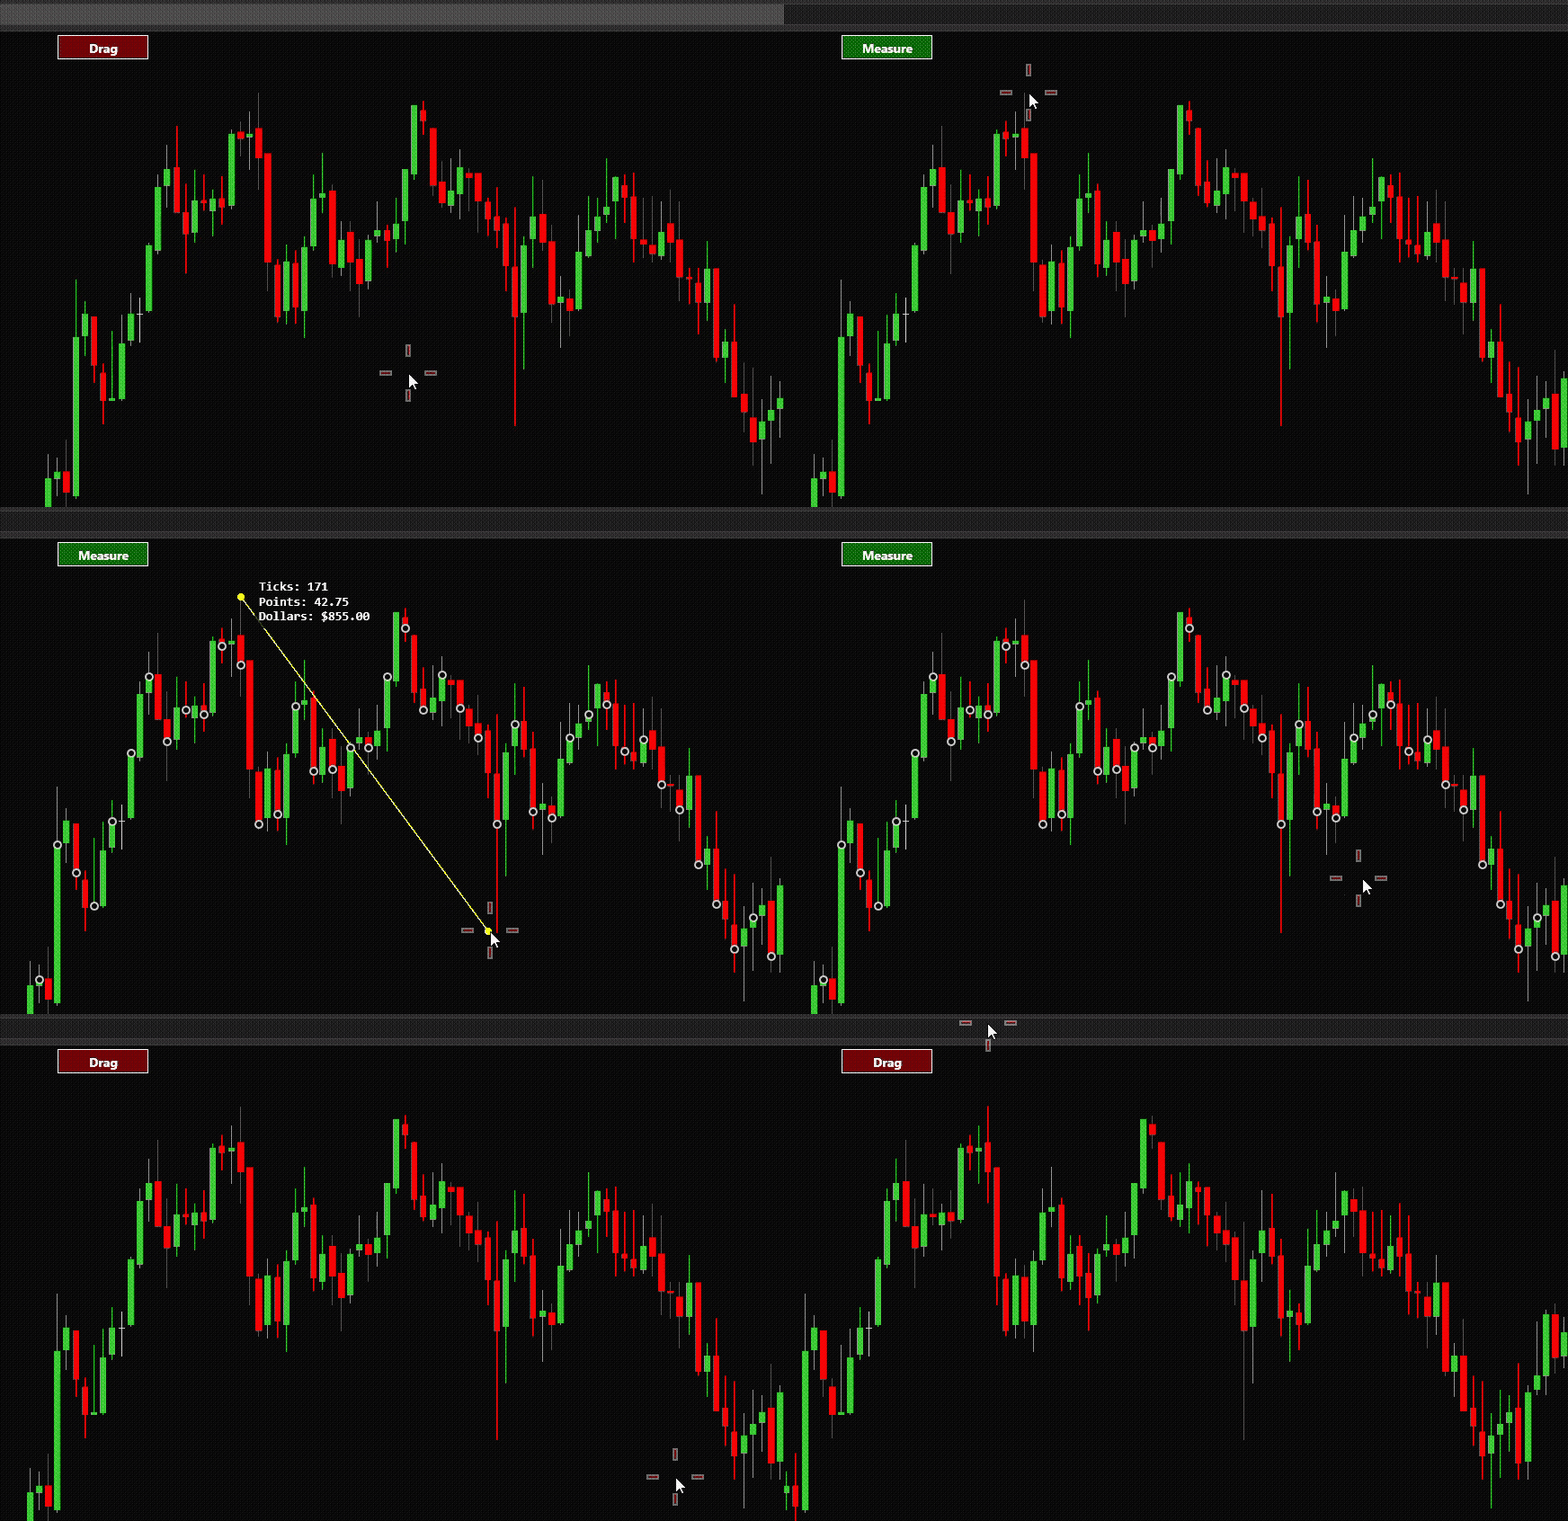
#region Using declarations
using System;
using System.ComponentModel;
using System.ComponentModel.DataAnnotations;
using System.Xml.Serialization;
using NinjaTrader.Data;
using NinjaTrader.Gui;
using NinjaTrader.Gui.Chart;
using NinjaTrader.Gui.Tools;
#endregion

namespace NinjaTrader.NinjaScript.Indicators
{
    public class DistanceRuler : Indicator
    {
        // =====================================================================
        // Member variables — interaction state (UI thread)
        // =====================================================================
        private bool _mouseSubscribed;
        private bool _isDrawing;
        private bool _isMeasureMode = false; // Tracks if the ruler is active or if chart dragging is allowed; false so the indicator starts in drag mode

        private int _startBarIndex;
        private double _startPrice;

        private int _currentBarIndex;
        private double _currentPrice;

        private ChartScale _chartScale;

        // =====================================================================
        // Member variables — render thread only
        // =====================================================================
        private SharpDX.Direct2D1.SolidColorBrush _lineBrush;
        private SharpDX.Direct2D1.SolidColorBrush _bgBrush;
        private SharpDX.DirectWrite.Factory _dwFactory;
        private SharpDX.DirectWrite.TextFormat _labelTextFormat;
        private SharpDX.Direct2D1.SolidColorBrush _labelBrush;

        // Mode toggle button resources
        private SharpDX.Direct2D1.SolidColorBrush _btnBgBrushMeasure;
        private SharpDX.Direct2D1.SolidColorBrush _btnBgBrushDrag;
        private SharpDX.DirectWrite.TextFormat _btnTextFormat;
        // Pre-built once and reused every frame instead of paying DirectWrite layout
        // cost on every OnRender call (which fires continuously during pan/zoom).
        private SharpDX.DirectWrite.TextLayout _btnMeasureLayout;
        private SharpDX.DirectWrite.TextLayout _btnDragLayout;

        private System.Windows.Media.Color _builtLineColor;
        private System.Windows.Media.Color _builtTextColor;

        public override string DisplayName => "Distance Ruler";

        // =====================================================================
        // OnStateChange
        // =====================================================================
        protected override void OnStateChange()
        {
            if (State == State.SetDefaults)
            {
                Description = @"Draws a line from click to cursor and shows distance in ticks, points, and dollars.";
                Name = "DistanceRuler";
                Calculate = Calculate.OnBarClose;
                IsOverlay = true;
                DisplayInDataBox = false;
                DrawOnPricePanel = true;
                IsAutoScale = false;
                IsSuspendedWhileInactive = true;
                BarsRequiredToPlot = 0;

                LineColor = System.Windows.Media.Brushes.Yellow;
                TextColor = System.Windows.Media.Brushes.White;
                LineWidth = 1.5f;
            }
            else if (State == State.Configure)
            {
                // Reserved for series/plot configuration — none required for this drawing tool.
            }
            else if (State == State.Historical)
            {
                // ChartControl is guaranteed to be assigned by this point. Per NinjaTrader's
                // guidance, WPF chart events must only ever be added/removed on the UI
                // dispatcher thread — never from OnRender, which runs on the render thread.
                if (ChartControl != null)
                {
                    ChartControl.Dispatcher.InvokeAsync((Action)(() =>
                    {
                        SubscribeMouseEvents();
                    }));
                }
            }
            else if (State == State.Terminated)
            {
                if (ChartControl != null)
                {
                    ChartControl.Dispatcher.InvokeAsync((Action)(() =>
                    {
                        UnsubscribeMouseEvents();
                    }));
                }

                DisposeRenderResources();
                _dwFactory?.Dispose();
                _dwFactory = null;
            }
        }

        // =====================================================================
        // DirectX resource management (render thread)
        // =====================================================================
        public override void OnRenderTargetChanged()
        {
            DisposeRenderResources();

            if (RenderTarget == null) return;

            _builtLineColor = ResolveColor(LineColor);
            _lineBrush = new SharpDX.Direct2D1.SolidColorBrush(RenderTarget, ToColor4(_builtLineColor));

            _builtTextColor = ResolveColor(TextColor);
            _labelBrush = new SharpDX.Direct2D1.SolidColorBrush(RenderTarget, ToColor4(_builtTextColor));

            // Semi-transparent black background for readability
            _bgBrush = new SharpDX.Direct2D1.SolidColorBrush(RenderTarget, new SharpDX.Color4(0f, 0f, 0f, 0.75f));

            if (_dwFactory == null)
                _dwFactory = new SharpDX.DirectWrite.Factory(SharpDX.DirectWrite.FactoryType.Shared);

            _labelTextFormat = new SharpDX.DirectWrite.TextFormat(
                _dwFactory, "Consolas", SharpDX.DirectWrite.FontWeight.Bold,
                SharpDX.DirectWrite.FontStyle.Normal, SharpDX.DirectWrite.FontStretch.Normal, 14f)
            {
                TextAlignment = SharpDX.DirectWrite.TextAlignment.Leading,
                ParagraphAlignment = SharpDX.DirectWrite.ParagraphAlignment.Near,
            };

            // Button resources
            _btnBgBrushMeasure = new SharpDX.Direct2D1.SolidColorBrush(RenderTarget, new SharpDX.Color4(0.0f, 0.5f, 0.0f, 0.85f)); // Greenish
            _btnBgBrushDrag = new SharpDX.Direct2D1.SolidColorBrush(RenderTarget, new SharpDX.Color4(0.5f, 0.0f, 0.0f, 0.85f));    // Reddish

            _btnTextFormat = new SharpDX.DirectWrite.TextFormat(
                _dwFactory, "Segoe UI", SharpDX.DirectWrite.FontWeight.Bold,
                SharpDX.DirectWrite.FontStyle.Normal, SharpDX.DirectWrite.FontStretch.Normal, 14f)
            {
                TextAlignment = SharpDX.DirectWrite.TextAlignment.Center,
                ParagraphAlignment = SharpDX.DirectWrite.ParagraphAlignment.Center,
            };

            // Button text rarely changes (only on a click), so lay it out once here
            // rather than calling DrawText (which builds a fresh layout) every frame.
            _btnMeasureLayout = new SharpDX.DirectWrite.TextLayout(_dwFactory, "Measure", _btnTextFormat, 100f, 26f);
            _btnDragLayout = new SharpDX.DirectWrite.TextLayout(_dwFactory, "Drag", _btnTextFormat, 100f, 26f);
        }

        private void DisposeRenderResources()
        {
            _lineBrush?.Dispose(); _lineBrush = null;
            _labelBrush?.Dispose(); _labelBrush = null;
            _bgBrush?.Dispose(); _bgBrush = null;
            _labelTextFormat?.Dispose(); _labelTextFormat = null;

            _btnBgBrushMeasure?.Dispose(); _btnBgBrushMeasure = null;
            _btnBgBrushDrag?.Dispose(); _btnBgBrushDrag = null;
            _btnTextFormat?.Dispose(); _btnTextFormat = null;
            _btnMeasureLayout?.Dispose(); _btnMeasureLayout = null;
            _btnDragLayout?.Dispose(); _btnDragLayout = null;
        }

        protected override void OnBarUpdate()
        {
            // No data calculation required for this visual tool
        }

        // =====================================================================
        // Rendering (render thread)
        // =====================================================================
        protected override void OnRender(ChartControl chartControl, ChartScale chartScale)
        {
            if (State == State.Historical || RenderTarget == null) return;

            if (_lineBrush == null) OnRenderTargetChanged();

            // Defensive brush rebuilding if properties changed
            System.Windows.Media.Color desiredLineColor = ResolveColor(LineColor);
            if (desiredLineColor != _builtLineColor)
            {
                _lineBrush?.Dispose();
                _builtLineColor = desiredLineColor;
                _lineBrush = new SharpDX.Direct2D1.SolidColorBrush(RenderTarget, ToColor4(_builtLineColor));
            }

            System.Windows.Media.Color desiredTextColor = ResolveColor(TextColor);
            if (desiredTextColor != _builtTextColor)
            {
                _labelBrush?.Dispose();
                _builtTextColor = desiredTextColor;
                _labelBrush = new SharpDX.Direct2D1.SolidColorBrush(RenderTarget, ToColor4(_builtTextColor));
            }

            _chartScale = chartScale;

            if (double.IsNaN(chartControl.ActualWidth) || chartControl.ActualWidth <= 0) return;

            // --- Draw Mode Toggle Button ---
            double btnWidth = 100;
            double btnHeight = 26;
            double btnX = (chartControl.ActualWidth - btnWidth) / 2;
            double btnY = 5;

            var btnRect = new SharpDX.RectangleF((float)btnX, (float)btnY, (float)btnWidth, (float)btnHeight);
            RenderTarget.FillRectangle(btnRect, _isMeasureMode ? _btnBgBrushMeasure : _btnBgBrushDrag);
            RenderTarget.DrawRectangle(btnRect, _labelBrush, 1.0f);

            var btnLayout = _isMeasureMode ? _btnMeasureLayout : _btnDragLayout;
            RenderTarget.DrawTextLayout(new SharpDX.Vector2((float)btnX, (float)btnY), btnLayout, _labelBrush);
            // -------------------------------

            if (!_isDrawing) return;

            // Calculate pixel coordinates from the snapped prices
            float startX = (float)chartControl.GetXByBarIndex(ChartBars, _startBarIndex);
            float startY = (float)chartScale.GetYByValue(_startPrice);

            float endX = (float)chartControl.GetXByBarIndex(ChartBars, _currentBarIndex);
            float endY = (float)chartScale.GetYByValue(_currentPrice);

            // Draw main line
            RenderTarget.DrawLine(new SharpDX.Vector2(startX, startY), new SharpDX.Vector2(endX, endY), _lineBrush, LineWidth);

            // Draw anchor endpoints
            var startCircle = new SharpDX.Direct2D1.Ellipse(new SharpDX.Vector2(startX, startY), 4f, 4f);
            RenderTarget.FillEllipse(startCircle, _lineBrush);
            var endCircle = new SharpDX.Direct2D1.Ellipse(new SharpDX.Vector2(endX, endY), 4f, 4f);
            RenderTarget.FillEllipse(endCircle, _lineBrush);

            // Calculate distances (prices are already snapped to valid ticks)
            double pointValue = Instrument?.MasterInstrument?.PointValue ?? 0;
            double tickSize = Instrument?.MasterInstrument?.TickSize ?? 1;

            double priceDiff = Math.Abs(_startPrice - _currentPrice);
            double ticks = tickSize > 0 ? priceDiff / tickSize : 0;
            double points = priceDiff;
            double dollars = priceDiff * pointValue;

            string label = $"Ticks: {ticks:F0}\nPoints: {points:F2}\nDollars: {dollars:C}";

            // Render label with background using TextLayout for accurate metrics
            using (var textLayout = new SharpDX.DirectWrite.TextLayout(
                _dwFactory,
                label,
                _labelTextFormat,
                200f,
                100f))
            {
                float textWidth = textLayout.Metrics.Width;
                float textHeight = textLayout.Metrics.Height;

                // Position label near the START cursor (stationary anchor point)
                float labelX = startX + 15f;
                float labelY = startY - textHeight / 2;

                // Keep label within chart bounds (flip to left side if hitting right edge)
                if (labelX + textWidth + 10f > chartControl.ActualWidth)
                    labelX = startX - textWidth - 25f;
                if (labelY < 0)
                    labelY = 5f;
                if (labelY + textHeight + 10f > chartControl.ActualHeight)
                    labelY = (float)chartControl.ActualHeight - textHeight - 15f;

                var bgRect = new SharpDX.RectangleF(labelX, labelY, textWidth + 10f, textHeight + 10f);
                RenderTarget.FillRectangle(bgRect, _bgBrush);

                var textRect = new SharpDX.RectangleF(labelX + 5f, labelY + 5f, textWidth, textHeight);
                RenderTarget.DrawTextLayout(new SharpDX.Vector2(textRect.X, textRect.Y), textLayout, _labelBrush);
            }
        }

        // =====================================================================
        // Mouse interaction (UI / WPF dispatcher thread)
        // =====================================================================
        private void SubscribeMouseEvents()
        {
            if (ChartControl == null || _mouseSubscribed) return;
            ChartControl.MouseLeftButtonDown += OnMouseLeftButtonDown;
            ChartControl.MouseLeftButtonUp += OnMouseLeftButtonUp;
            // MouseMove is intentionally NOT subscribed here. It's only attached while
            // a ruler drag is actually in progress (see OnMouseLeftButtonDown/Up below).
            // Chart panning/zooming generates a continuous stream of MouseMove events,
            // so leaving this subscribed for the indicator's whole lifetime means every
            // one of those events gets dispatched into managed code for no reason,
            // which is the main source of CPU overhead in Drag mode.
            _mouseSubscribed = true;
        }

        private void UnsubscribeMouseEvents()
        {
            if (ChartControl == null || !_mouseSubscribed) return;
            ChartControl.MouseLeftButtonDown -= OnMouseLeftButtonDown;
            ChartControl.MouseLeftButtonUp -= OnMouseLeftButtonUp;
            ChartControl.MouseMove -= OnMouseMove; // no-op if not currently subscribed
            _mouseSubscribed = false;
        }

        private void OnMouseLeftButtonDown(object sender, System.Windows.Input.MouseButtonEventArgs e)
        {
            if (ChartBars == null || _chartScale == null || ChartControl == null) return;
            if (double.IsNaN(ChartControl.ActualWidth) || ChartControl.ActualWidth <= 0) return;

            System.Windows.Point pos = e.GetPosition(ChartControl);

            // Hit test the mode toggle button
            double btnWidth = 100;
            double btnHeight = 26;
            double btnX = (ChartControl.ActualWidth - btnWidth) / 2;
            double btnY = 5;

            System.Windows.Rect labelRect = new System.Windows.Rect(btnX, btnY, btnWidth, btnHeight);

            if (!_isDrawing && labelRect.Contains(pos))
            {
                _isMeasureMode = !_isMeasureMode;
                ChartControl.InvalidateVisual();
                e.Handled = true;
                return;
            }

            // Double click to exit measure mode quickly
            if (_isMeasureMode && e.ClickCount == 2)
            {
                _isMeasureMode = false;
                _isDrawing = false;
                if (ChartControl.IsMouseCaptured)
                    ChartControl.ReleaseMouseCapture();
                ChartControl.InvalidateVisual();
                e.Handled = true;
                return;
            }

            // If not in measure mode, do not intercept the click (allow chart panning/dragging)
            if (!_isMeasureMode) return;

            _startBarIndex = BarIdxFromX(pos.X);
            double rawStartPrice = _chartScale.GetValueByY((float)pos.Y);
            _startPrice = SnapPriceToTick(rawStartPrice);

            _currentBarIndex = _startBarIndex;
            _currentPrice = _startPrice;

            _isDrawing = true;
            ChartControl.CaptureMouse();
            ChartControl.MouseMove += OnMouseMove;
            ChartControl.InvalidateVisual();
            e.Handled = true;
        }

        private void OnMouseMove(object sender, System.Windows.Input.MouseEventArgs e)
        {
            if (!_isDrawing || ChartBars == null || _chartScale == null) return;

            System.Windows.Point pos = e.GetPosition(ChartControl);

            _currentBarIndex = BarIdxFromX(pos.X);
            double rawCurrentPrice = _chartScale.GetValueByY((float)pos.Y);
            _currentPrice = SnapPriceToTick(rawCurrentPrice);

            ChartControl.InvalidateVisual();
        }

        private void OnMouseLeftButtonUp(object sender, System.Windows.Input.MouseButtonEventArgs e)
        {
            if (!_isDrawing) return;

            _isDrawing = false;
            ChartControl.MouseMove -= OnMouseMove;
            ChartControl.ReleaseMouseCapture();
            ChartControl.InvalidateVisual();
        }

        // =====================================================================
        // Helpers
        // =====================================================================
        private double SnapPriceToTick(double price)
        {
            if (Instrument?.MasterInstrument != null && Instrument.MasterInstrument.TickSize > 0)
            {
                return Instrument.MasterInstrument.RoundToTickSize(price);
            }
            return price;
        }

        private System.Windows.Media.Color ResolveColor(System.Windows.Media.Brush brush)
        {
            return (brush as System.Windows.Media.SolidColorBrush)?.Color ?? System.Windows.Media.Colors.Yellow;
        }

        private static SharpDX.Color4 ToColor4(System.Windows.Media.Color c)
        {
            return new SharpDX.Color4(c.R / 255f, c.G / 255f, c.B / 255f, c.A / 255f);
        }

        private int BarIdxFromX(double x)
        {
            if (ChartBars == null) return 0;
            int first = ChartBars.FromIndex;
            int last = ChartBars.ToIndex;
            if (first >= last) return first;

            double x0 = ChartControl.GetXByBarIndex(ChartBars, first);
            double x1 = ChartControl.GetXByBarIndex(ChartBars, last);
            if (Math.Abs(x1 - x0) < 1.0) return first;

            double t = (x - x0) / (x1 - x0);
            int b = (int)Math.Round(first + t * (last - first));
            return Math.Max(first, Math.Min(last, b));
        }

        // =====================================================================
        // Properties
        // =====================================================================
        [NinjaScriptProperty]
        [Range(0.5f, 5f)]
        [Display(Name = "Line Width", Description = "Ruler line stroke width in pixels", GroupName = "Parameters", Order = 1)]
        public float LineWidth { get; set; }

        [XmlIgnore]
        [NinjaScriptProperty]
        [Display(Name = "Line Color", Description = "Color of the ruler line", GroupName = "Parameters", Order = 2)]
        public System.Windows.Media.Brush LineColor { get; set; }

        [Browsable(false)]
        public string LineColorSerializable
        {
            get { return Serialize.BrushToString(LineColor); }
            set { LineColor = Serialize.StringToBrush(value); }
        }

        [XmlIgnore]
        [NinjaScriptProperty]
        [Display(Name = "Text Color", Description = "Color of the label text", GroupName = "Parameters", Order = 3)]
        public System.Windows.Media.Brush TextColor { get; set; }

        [Browsable(false)]
        public string TextColorSerializable
        {
            get { return Serialize.BrushToString(TextColor); }
            set { TextColor = Serialize.StringToBrush(value); }
        }
    }
}