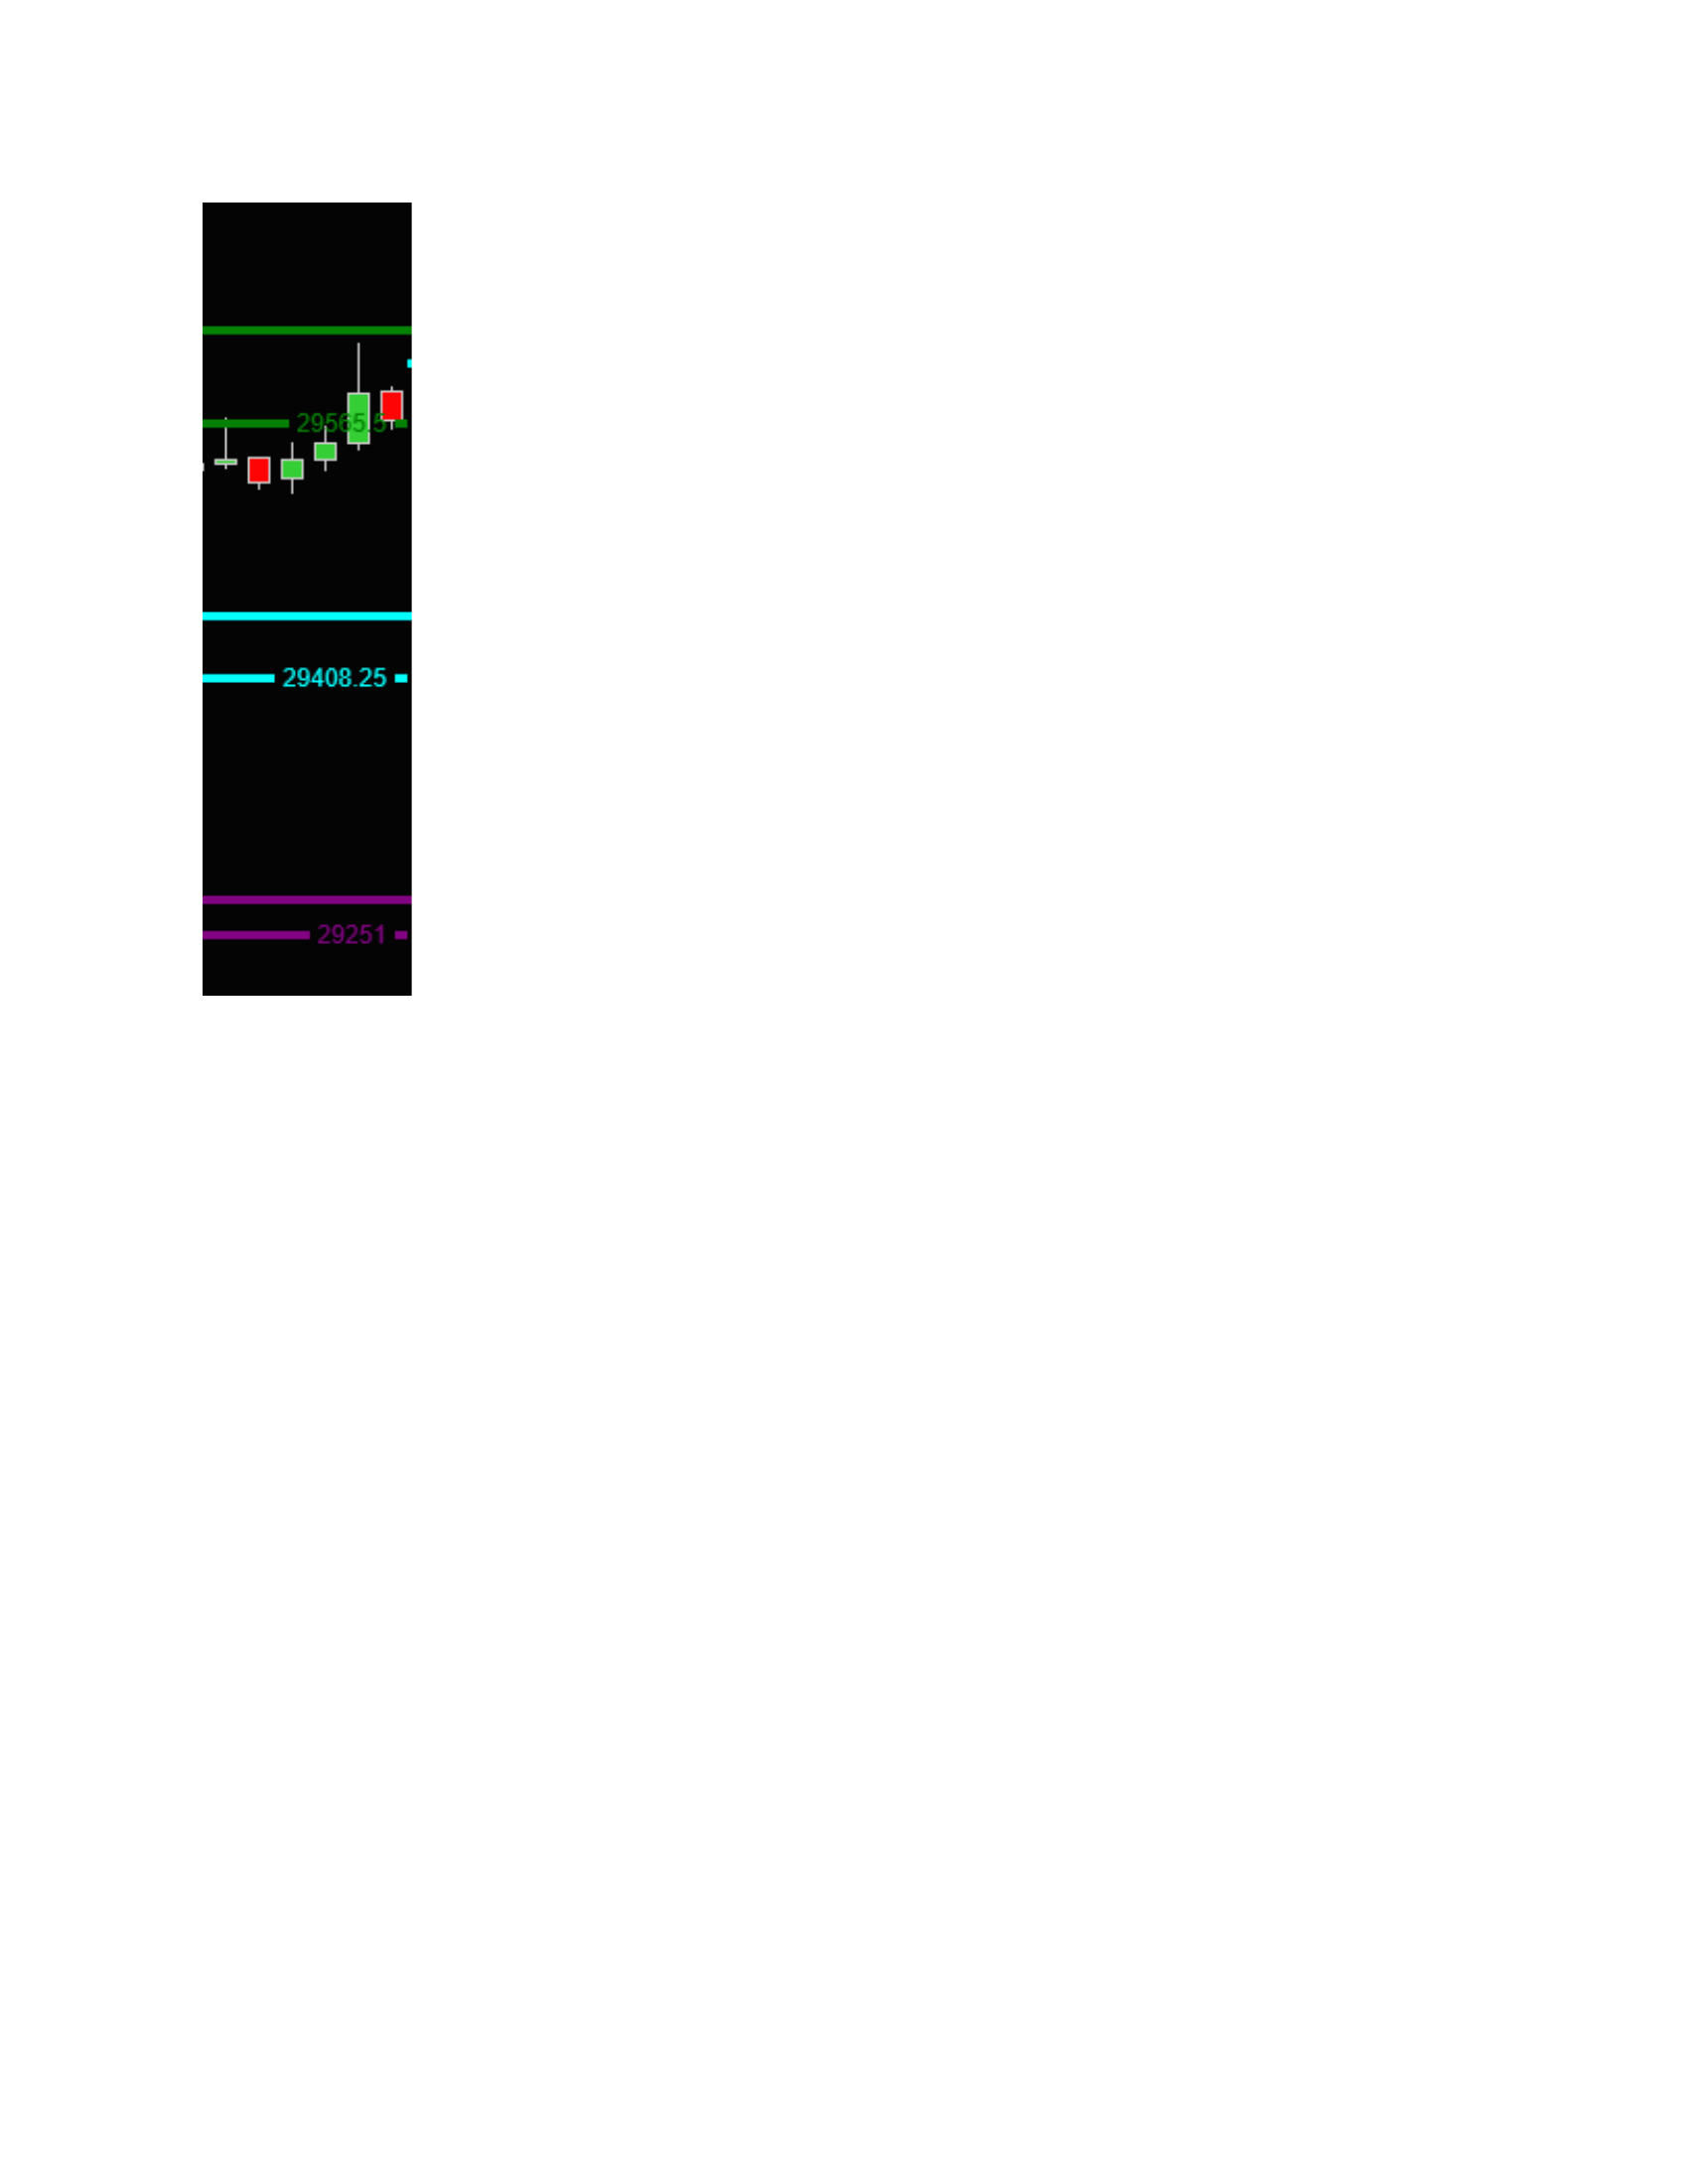
SharpDX DrawLine() and DrawTextLayout(). It’s actually 2 lines if you want the price in the middle like that…
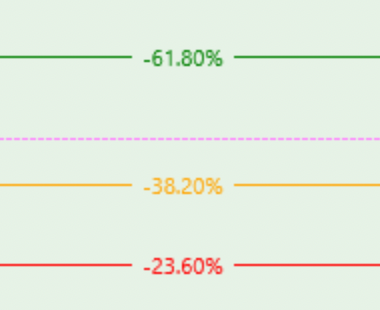
NinjaTrader has a complete starting example in the OnRender documentation: NinjaScript > Language Reference > Common > Charts > Rendering > OnRender()
It draws a horizontal line and the plot name/value together. The important connection is chartScale.GetYByValue(price): the line and its label need the same price-to-pixel conversion, recalculated when the chart renders. A fixed screen Y coordinate will drift away from the price when you rescale the chart.
For the gap in the middle that several describes, measure the text layout, leave that width plus padding between the two line segments, and draw the label in that gap. Also retain base.OnRender(chartControl, chartScale) if your indicator uses normal plots alongside the custom drawing. The example shows disposal of its text resources too.
Are your existing lines plots, Draw.Line objects, or already drawn in OnRender? That determines where the small replacement section belongs.
Thank you both for your replies. I want the price to display on the right side margin of the chart with a X-pixel indentation. Also, as these levels change/reset I would like the historical price at that level to be visible when scrolling left.
That adds two separate requirements: a label anchored to the visible panel edge, and a history of the level values. Keep those separate.
For a label just inside the right edge of the plotting panel, its left edge can be ChartPanel.X + ChartPanel.W - padding - textWidth. Its vertical position still comes from chartScale.GetYByValue(the selected level). That is different from drawing inside the price-scale gutter.
For the historical part, preserve each level with its effective bar or time interval. A single current-level variable cannot recover an older value after it has been overwritten. If you want the right-edge label to describe the period currently being viewed, select the stored level valid at ChartBars.ToIndex, not automatically the latest live value.
ToIndex is the last visible bar. The rendering example shows the panel coordinates.
One detail decides the next step: when you scroll back, should the margin show only the level active at the rightmost visible bar, or every historical level segment visible on screen? Those need different label-selection rules.
Each historical level should show it’s historical price where that level was. I hope that makes sense.
Yes, that makes sense. Each historical segment needs its own stored price, rather than a label that reads the latest level variable.
I would keep a record for each segment: start bar/time, end bar/time and price. When the level resets, finish that record and start a new one. Draw the visible segments and format each label from that segment’s price.
For labels beside the historical segments, anchor each label to its segment. If every label must stay at the right edge instead, use the same panel-edge X position but each segment’s own price for Y, and define what happens when labels overlap.
The next useful piece is the small section that creates or resets your lines. Please paste that section here, with private strategy details removed. That will show whether the change belongs in a plot series, Draw.Line objects or your OnRender loop.
Thank you so much. That worked and gave me a better understanding on the coding.