Weird request i know but Brushes.Transparent does not work for me here . and Width = 0 still plots as 1.
Its a minor bug but i wonder if any C# experts out there can think laterally on this one?
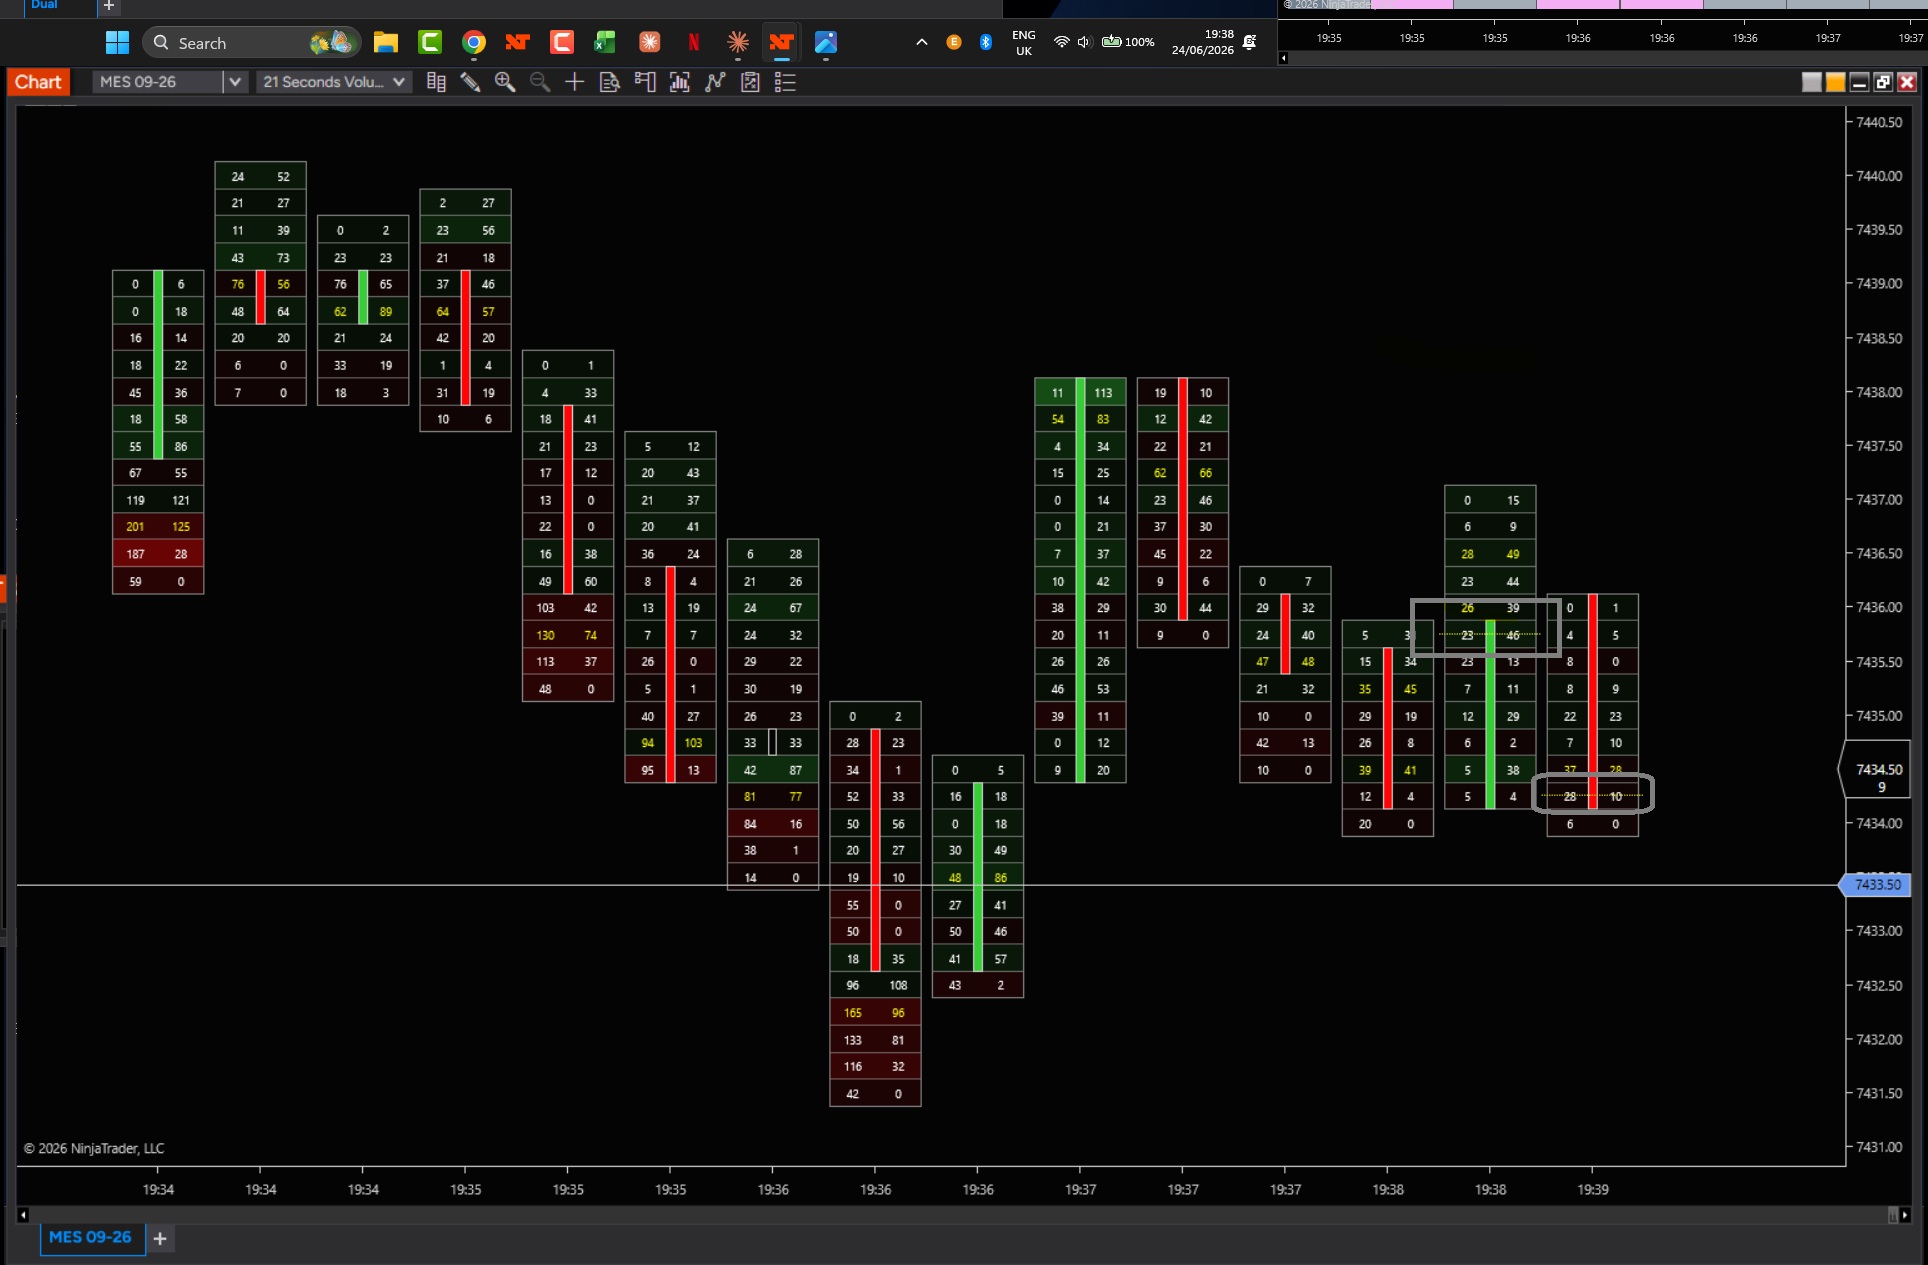
The issue is that on flashing ( intermittent change of background) i get a flash coloured line on each bar’s close on every other tick. The transparent line of course is not visible. I need the dummy plot to plot in the price axis hence my weird demands!
		#region dummy plot - used for PriceMarker option only

				AddPlot(new Stroke(Brushes.Transparent, DashStyleHelper.Dot, 0), PlotStyle.Dot,  "DummyPlot");
				#endregion
@Mindset - I used to have the problem trying to use a transparent line to use to keep the screen at a constant scale during narrow range choppy times. Then I switched to:
if (State == State.Historical)
{
if (ChartControl != null)
{
myBackgroundBrush = ChartControl.Properties.ChartBackground;
}
}
(Sorry for the mess. I don’t know how to post code like in the old forum.)
Anyways, then if I use a BackBrush, I just change the color of the plot to the current BackBrush color. It still can appear in the Data Box and be use in calculations if you are not using Series instead of plots.
Hi Robotman thanks for the input however coloring the plot to ChartBackground only hides the line where the chart is that solid background color. On a volumetric chart, the bars paint cells (volume numbers, bid/ask backgrounds, imbalance highlights) that are not the chart-background color. The dummy plot’s hash is drawn across the price panel and crosses those cells — and over a colored cell, a background-colored dot is still visible.
That’s the frustration and neither me nor Claude can find a way around it.
I’m not sure I understood your question correctly, but if all you want is for the Plot value to be shown on the price axis, try using PlotStyle = PriceBox.
hi - we tried that and it does not change the behaviour i am seeing. I think because we are not allowed access to the price axis properties that I need. Here is a pic which demonstrates the plots i am trying to get rid of - they flash intermittently on every close whenever my bartimer alarm goes off. Not the biggest problem and pretty much invisible on a candlestick chart - just irritates me on Volumetric charts