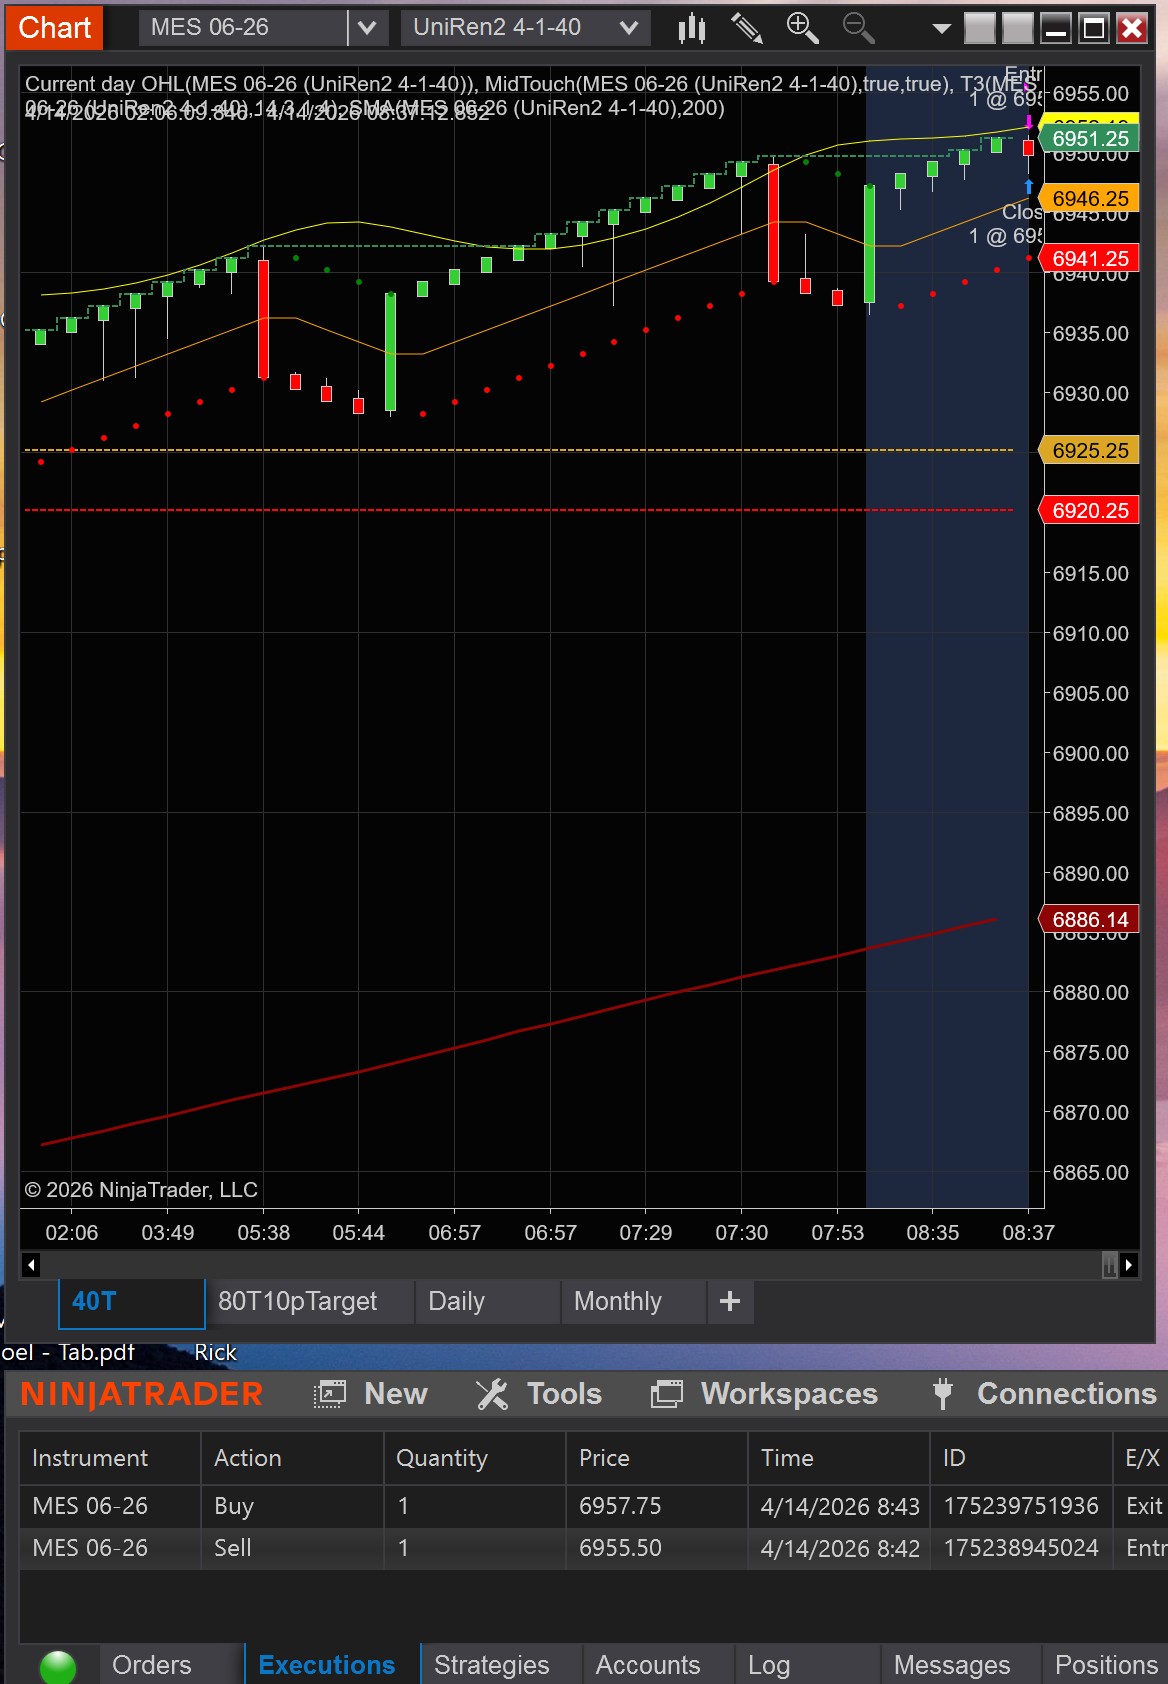
I placed a limit order to sell above the current price, and the order “filled” at a level above where the market hadn’t even gotten to! Furthermore, the chart shows the markers on the most current bar instead of where it should be several bars before.
I scheduled a call back from technical support, but they didn’t have any appointments open until NEXT MONDAY!!??
1 Like
You got a better fill than you were expecting, right? So why are you complaining? ![]()
Kidding aside, maybe look at it on a time based chart like 1-min or 15-sec and see if timing and level line up better. There’s something funky about those UniRenko bars and if you get a price gap, it will still give you some fake candles at those skipped prices, but they will all get the same exact timestamp which may mess with the placement of other objects. I’m not saying this is what’s happening in your case. Just saying that you should look at another chart with a different bar type to see if what you observe is closer to what you’re expecting.
I see this is a different UniRenko than the one available from NT Ecosystem. The Ecosystem one (with BarsPeriodType=2018) is actually buggy and reports volume incorrectly and double counts the volume of the first tick in each bar. I wrote support about it a while back, but they said they didn’t own the code and refused to correct it. It’s very possible it might have other issues. If your UniRenko is based on the original UniRenko logic, it might have inherited those issues and could be showing things incorrectly. Again, not saying this is absolutely the case, but I would question and verify what you see with UniRenko.
Bottom line, try a time based chart to see if things make more sense based on what you’re expecting.
Oh, and I assume this was an actual fill and not SIM? If it was SIM, you could potentially get a fill from SIM, but price never actually traded there on the exchange, so your fill price may be outside the actual range that price traded.
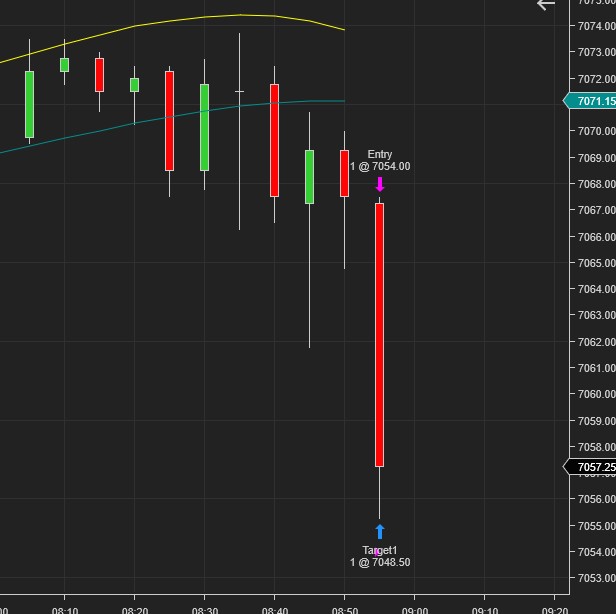
Thanks for taking the time to respond. I understand what you are saying. However, the five minute chart shows the same entry & exit prices as the UniRenko. My statement for the day shows trades at price levels that didn’t exist at the time of the trade. You can see the issue clearly here on the five minute chart. The entry and target are not even where the market is.
1 Like
Is it possible you might have multiple data series on the same chart? For example ES and MES? Maybe you’re viewing one instrument and trading the other and the execution shown on the chart is from the other instrument? During a burst of high trading volume, it is possible the two may trade a different price for a split second before converging again.
This is the only other explanation I can think of.
Only one data series, MES. Also, I’d like to point out that the bug you mentioned in UniRenko bar type was corrected. The new UniRenko bars with the bug correction is called UniRenko2
1 Like
Don’t be surprised by NinjaTrader anymore after the kind of broken, laggy platform they’ve built. A few days ago I had exactly the same situation as you. At the moment of entry, I got a price 80 points lower on Nasdaq. Good thing I recorded a video — no one would have believed it otherwise. I’m watching the chart move in my favor, but the report shows -70 and I’m shocked. Then reviewing the video, I noticed the price in Chart Trader was different from the one on the chart. How is that even possible?
Of course I contacted support. As usual, I got a ridiculous response: “your charts are the problem.” So apparently it’s my fault. The head of support, Luis, replied — definitely not someone in the right role. I asked: why isn’t there a warning if there’s a delay between the chart and Chart Trader data? He said they are aware of the discrepancy but don’t want to add any in-platform notice because they’ll get spammed with support requests. I told him, are you serious? What kind of logic is that? You’d rather people lose money than do your job properly? Then he blamed me, saying I must have installed something. I asked how that has anything to do with price discrepancies and the lack of warning — and he just disappeared.
And this is already the third time this year. Don’t tell me about internet issues, indicators, or any of that nonsense.
Also, I’ve never had this kind of nonsense happen on Lightspeed or eSignal — not once. The only thing keeping me on this miserable platform is that I’ve already written a lot of code specifically for it.