Hello.
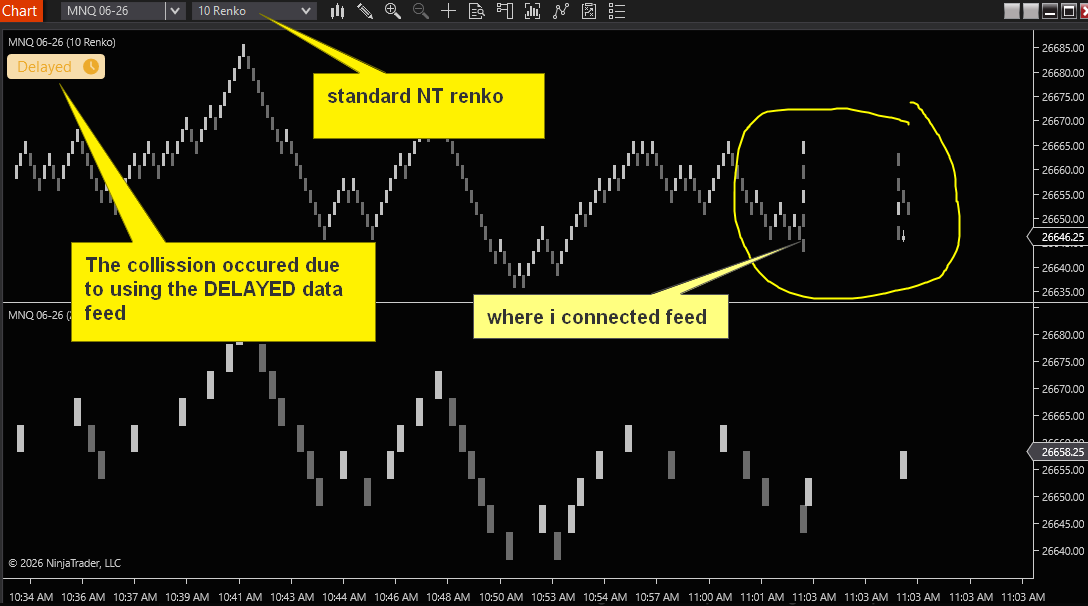
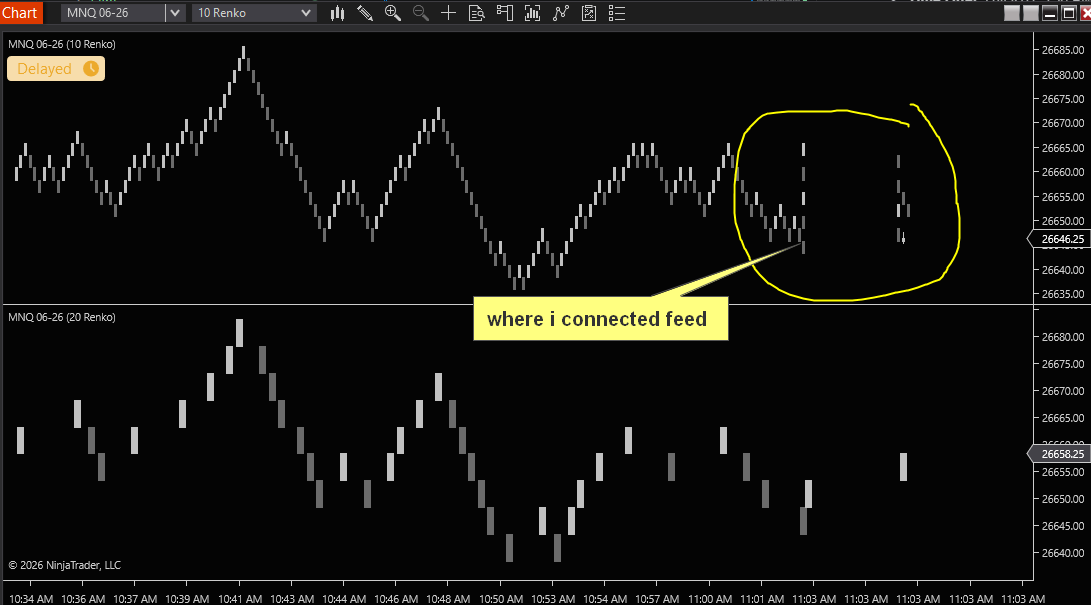
I’ve noticed what seems to be a bug in NT itself with collisions that occur when loading Renko bars of different sizes on the same chart(one primary, one secondary) series.
This works fine w/no data feed connected and the chart is built w/historical data.
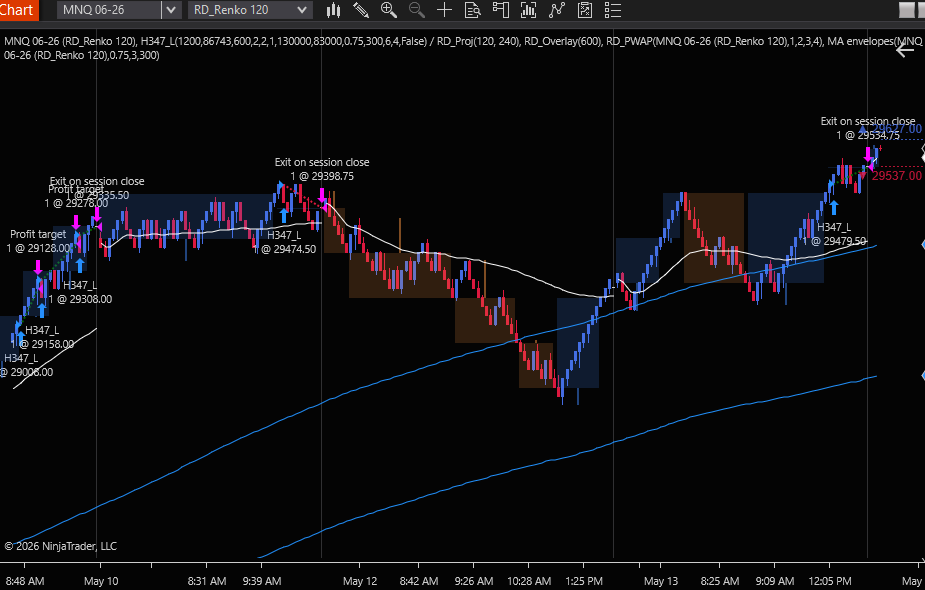
I noticed this issue as I built my own renko bar, modeled off the stock NT renko bar, and realized this issue existed in the standard one also.
When there is no feed connected, workspace open, and then connecting to a data feed, the bars begin stacking on top of one another.
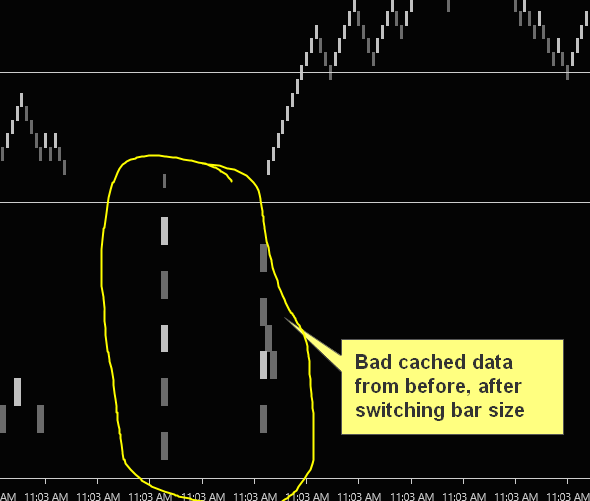
I can temporarily repair this error by opening up the chart settings, switching the bar sizes to a different value, and then the chart will seemingly repair itself. Although any cached data that was built incorrectly will be built into the data. See image below:
[img2]
However, after the chart runs a while, and this happens randomly, the error exceptions below will pop up. That and one or both of the series will again begin misprinting or omitting bars.
[img3]
I think the issue is that the multi-series use a merged x-axis computed during the workspace’s start, and that layout goes stale during live ticks because each series has a timestamp that gets rewritten on each tick in UpdateBar(). Over time, the cached layout and live timestamps drift apart, and and the render loop that draws the chart style against a collection that isn’t there, causing the IndexOutOfRange errors.
To put it more simply, consecutive bars can be emitted w/identical timestamps during live ticks. W/one series, this is no problem. But w/two series, the merged x-axis tries to index via these dupe timestamps and causes the out-of-range index lookups, which is what I think leads to the error?
I’m wondering if this is a known NT bug w/NTs renko bars, and if there is a way around this?