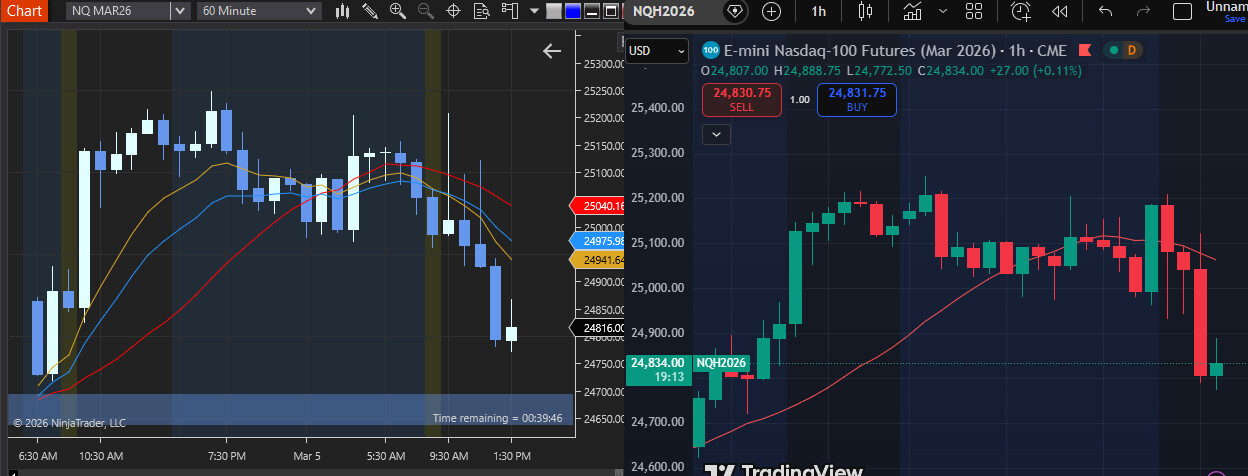
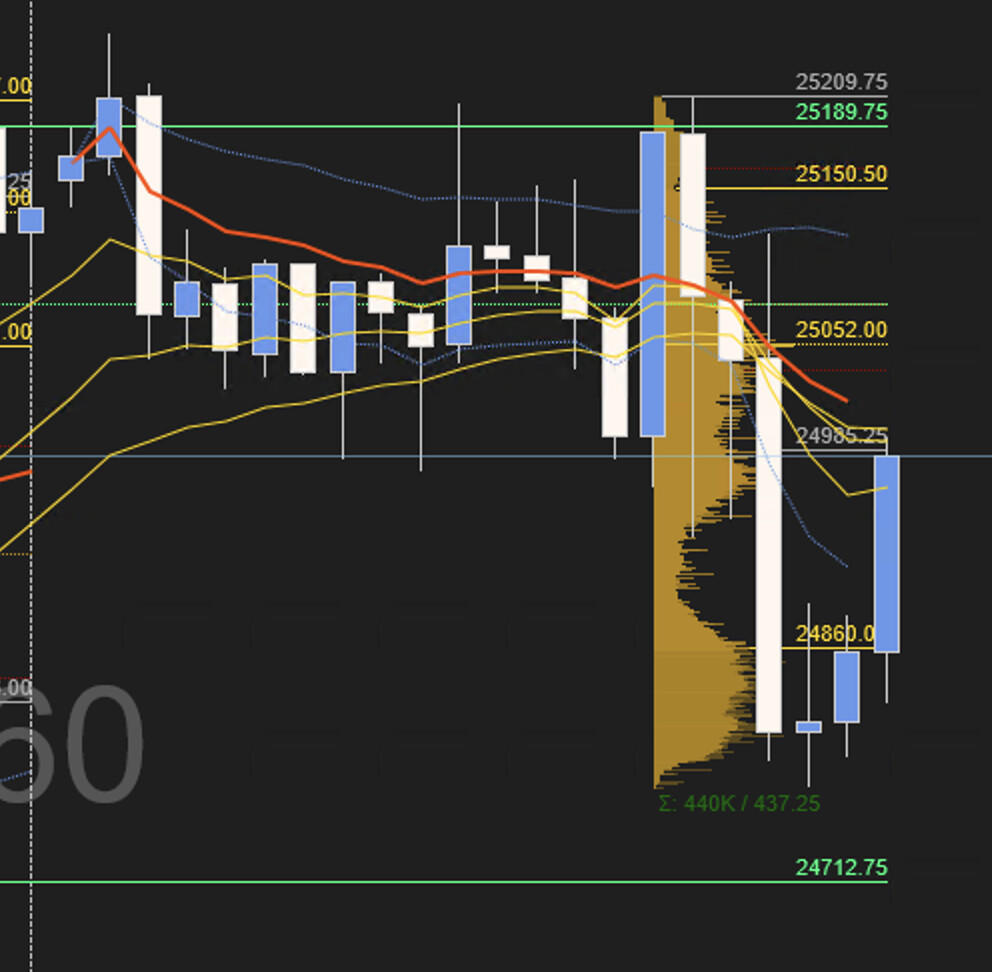
I came across an issue today and I’m very confused about what’s going on. My NT charts candle formations look very different than any other platform. Please take a look at the hourly chart showing today and yesterday. Every platform’s candles look just like the chart on the right. On NT, it shows a huge upper wick on the 9:30 candle, but you don’t see that on the other charts.
It is unchecked. This is very frustrating. I have been trying to figure this out for the last day.
When I go into Data Series and change it to CME US Index Futures RTH, it fixes the intraday candles but it doesn’t give me premarket data which I don’t want. Going back to ETH ruins the candles again.
I would keep Trading Hours in Data Series on either CME ETH or Instrument settings.
I would also keep the Break at EOD checked on all charts.
If that doesn’t fix your chart, then my next guess is that you might have some gaps in your data.
Reload your historical data (right click the chart > Reload all historical data).