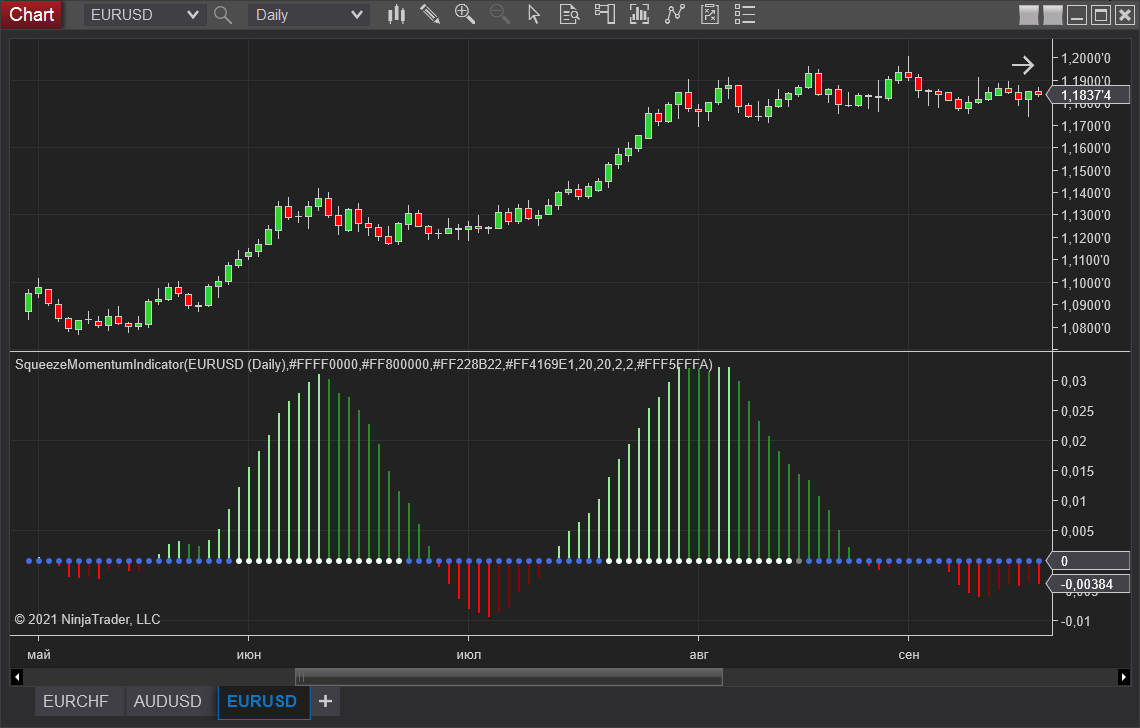
Can some one tell me what the blue dots, white dots and gray dot mean? Which dots are when the Keltner and Bollinger and are in a narrow range, and what dot means that the Bollinger has expanded outside the Keltner
etc?
Can some one tell me what the blue dots, white dots and gray dot mean? Which dots are when the Keltner and Bollinger and are in a narrow range, and what dot means that the Bollinger has expanded outside the Keltner
etc?
The dots come from LazyBear’s original: a squeeze is when the Bollinger Bands sit inside the Keltner Channel, and a release is when they break outside it. His script used black, gray and blue, but this port uses its own colors. On your chart the blue dots sit on the quiet stretches and the white dots on the big swings, so here blue marks the squeeze and white marks the release. If a third color shows up, it is the in between state, with the bands neither fully inside nor fully outside.
so there is a lone gray dot, it seems like when those appear there is a big move..so that mean neither fully inside or outside
The state and the color are separate here. LazyBear’s original uses black for squeeze-on, gray for squeeze-off and blue for neither. Your NT8 port may map those states to different colors, so I wouldn’t identify the gray dot from the screenshot alone.
In the original, squeeze-on means BOTH BB edges are strictly inside the KC. Squeeze-off means BOTH are strictly outside. Neither includes a mixed case, or an edge exactly equal to the KC. That describes the band relationship on that bar, not the size or direction of the next move.
The author links this corrected source: TTM squeeze clone [LazyBear] - Pastebin.com
Which exact NT8 indicator/version is this? If its source is available, the dot-color assignment is the line to check.