Personally, I’m pretty convinced this is the case based on the number of hours I’ve spent analyzing orderflow data to ensure my own tools are accurate. But it should be fairly easy to confirm if you are so inclined. I do have to post one disclaimer. I haven’t had time to upgrade to a newer version of NT on my dev system yet, and I’m still on 8.0.28 (I know, I know). The results below are from this system. It is very possible NT might have caught and fixed this in newer releases (although I doubt it), but it should be fairly easy to confirm that.
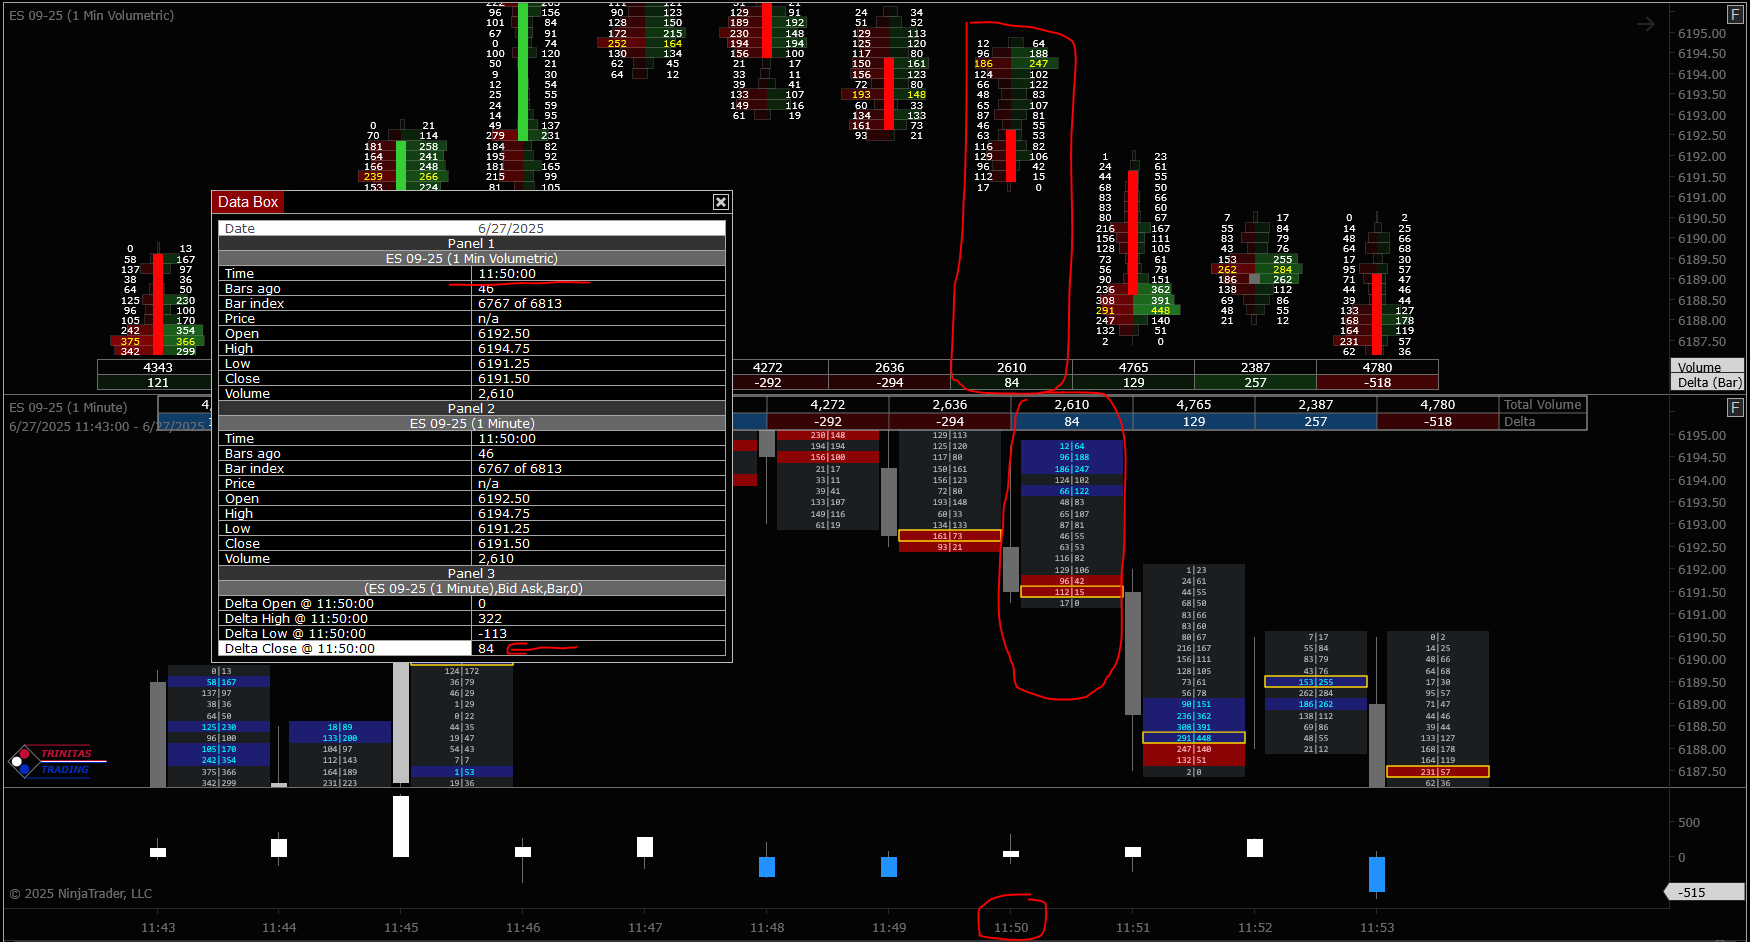
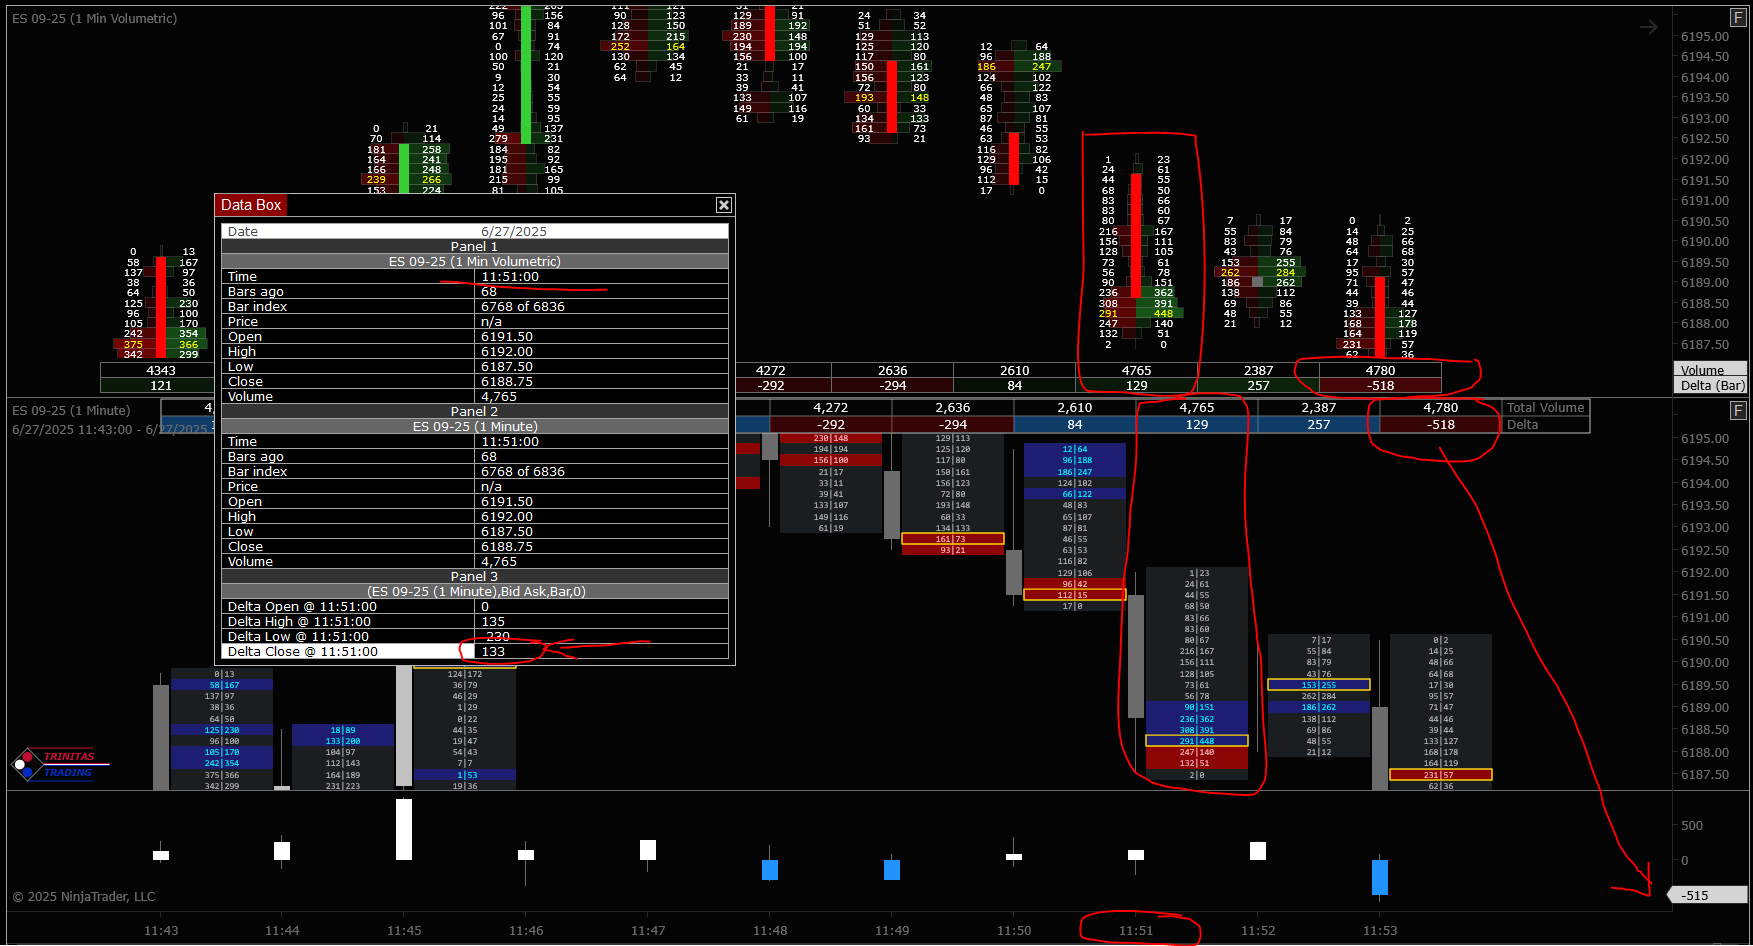
Below, I’m posting 2 charts with NT 1-min Volumetric bars on top panel, and my footprint on the bottom panel (also on 1-min) and NT Delta indicator on the bottom attached to the 1-min data series. You should be able to confirm from the images that bid/ask volumes from volumetric match mine exactly. I let this run for a few minutes. Historical data is accurate, but after a few minutes, Delta values start to deviate. I’m posting two screenshots: one from the last bar where Delta matched and the next bar where it started to deviate. Every subsequent bar has a Delta value that doesn’t match what the two footprints report.
Having said all this, I don’t think the discrepancy is detrimental and I believe it might have to do with how the last tick of bar is accounted for. Since NT has to abide by their own guidelines to make the Delta indicator synchronize with the primary data series (so that it can be used in an upstream indicator or strategy), the last tick (which would be based on a secondary 1-tick data series internally to the indicator, ie; BarsInProgress=1) cannot be assigned to the primary series that it aligns with since this would cause synchronization issues with the upstream script. So in case of NT Delta, the result of the last tick gets saved and added to the next/new bar because the indicator plot can only be updated in BarsInProgress=0 if synchronization is a requirement. I’m pretty sure this was a tradeoff NT engineering had to make to make the Delta indicator work in an upstream script with proper synchronization.
In case of the footprint, there is no such requirement and everything is graphical. So the last tick of bar can be assigned to the appropriate bar without causing any upstream synchronization issues. Hopefully this makes sense and isn’t super confusing.
And I’ll repeat again, that historical data is accurate because of how historical ticks are processed. This discrepancy only happens in real time. You’ll have to let it run in real time for a few minutes before you start seeing this discrepancy.