Hi,
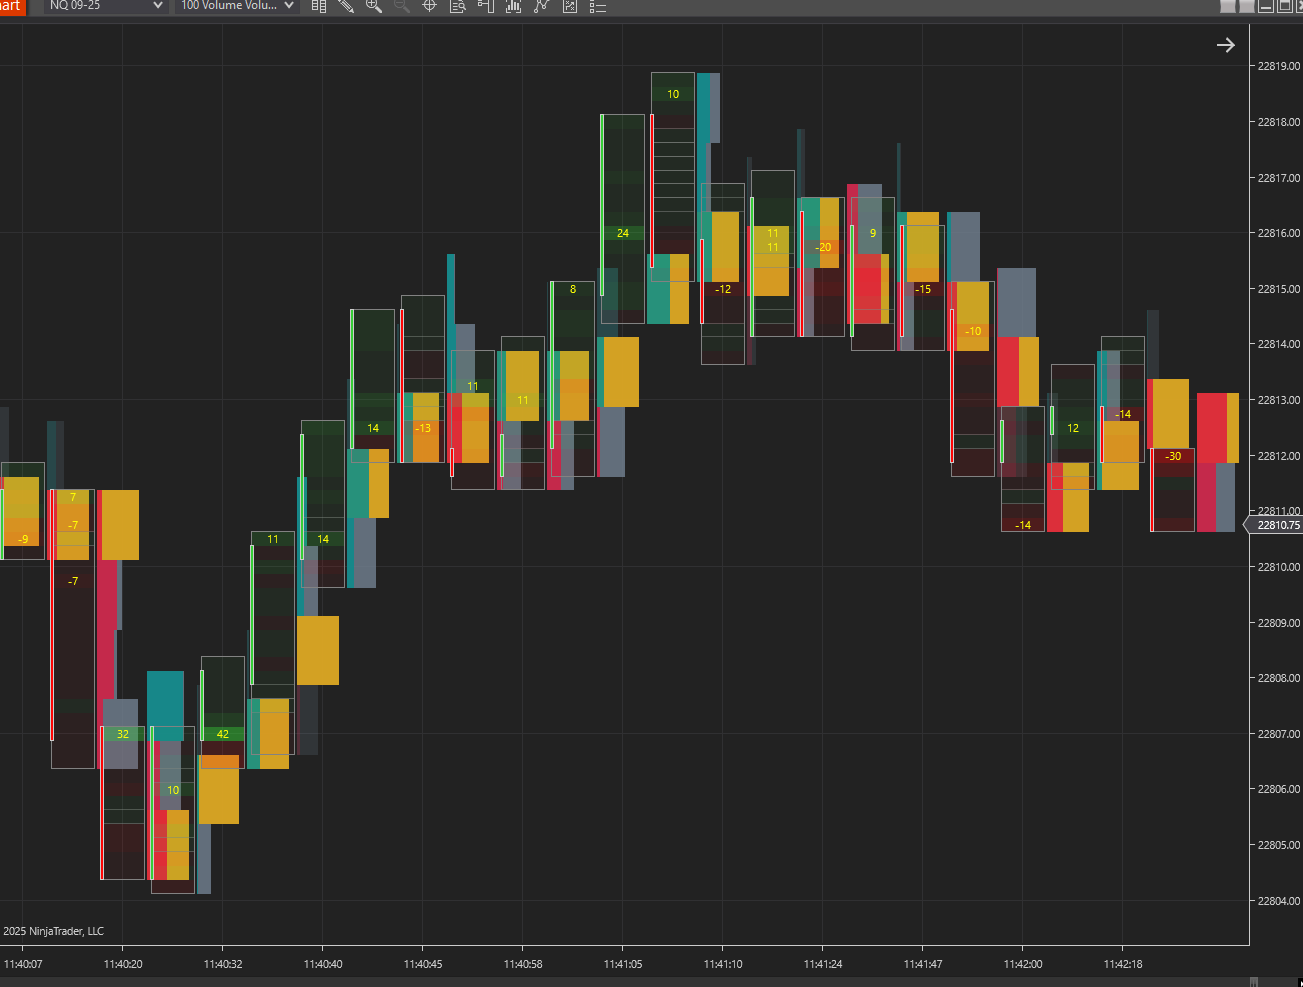
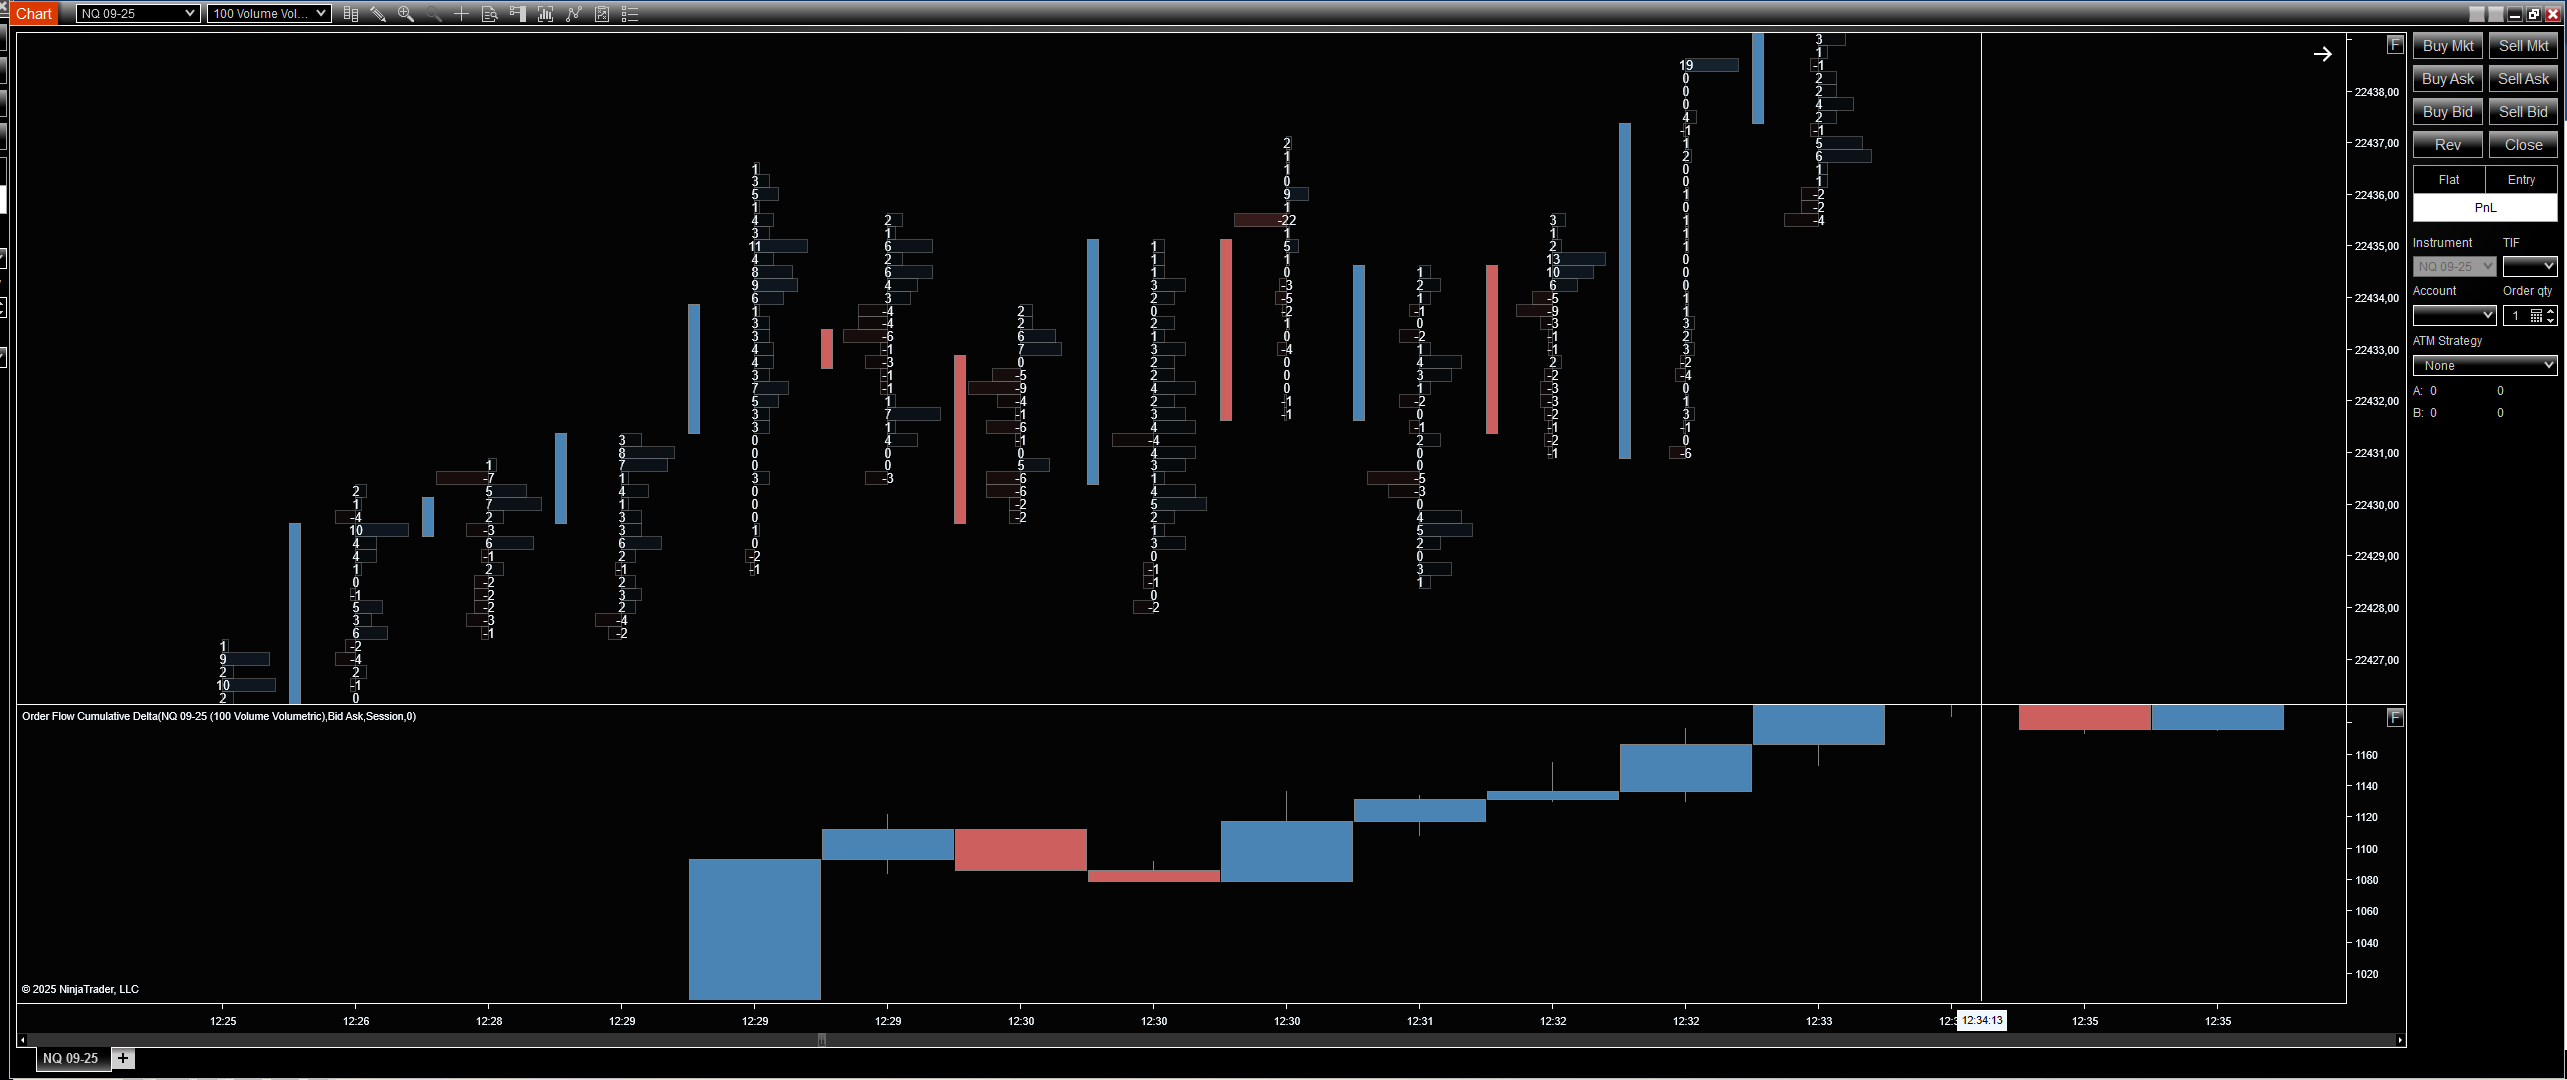
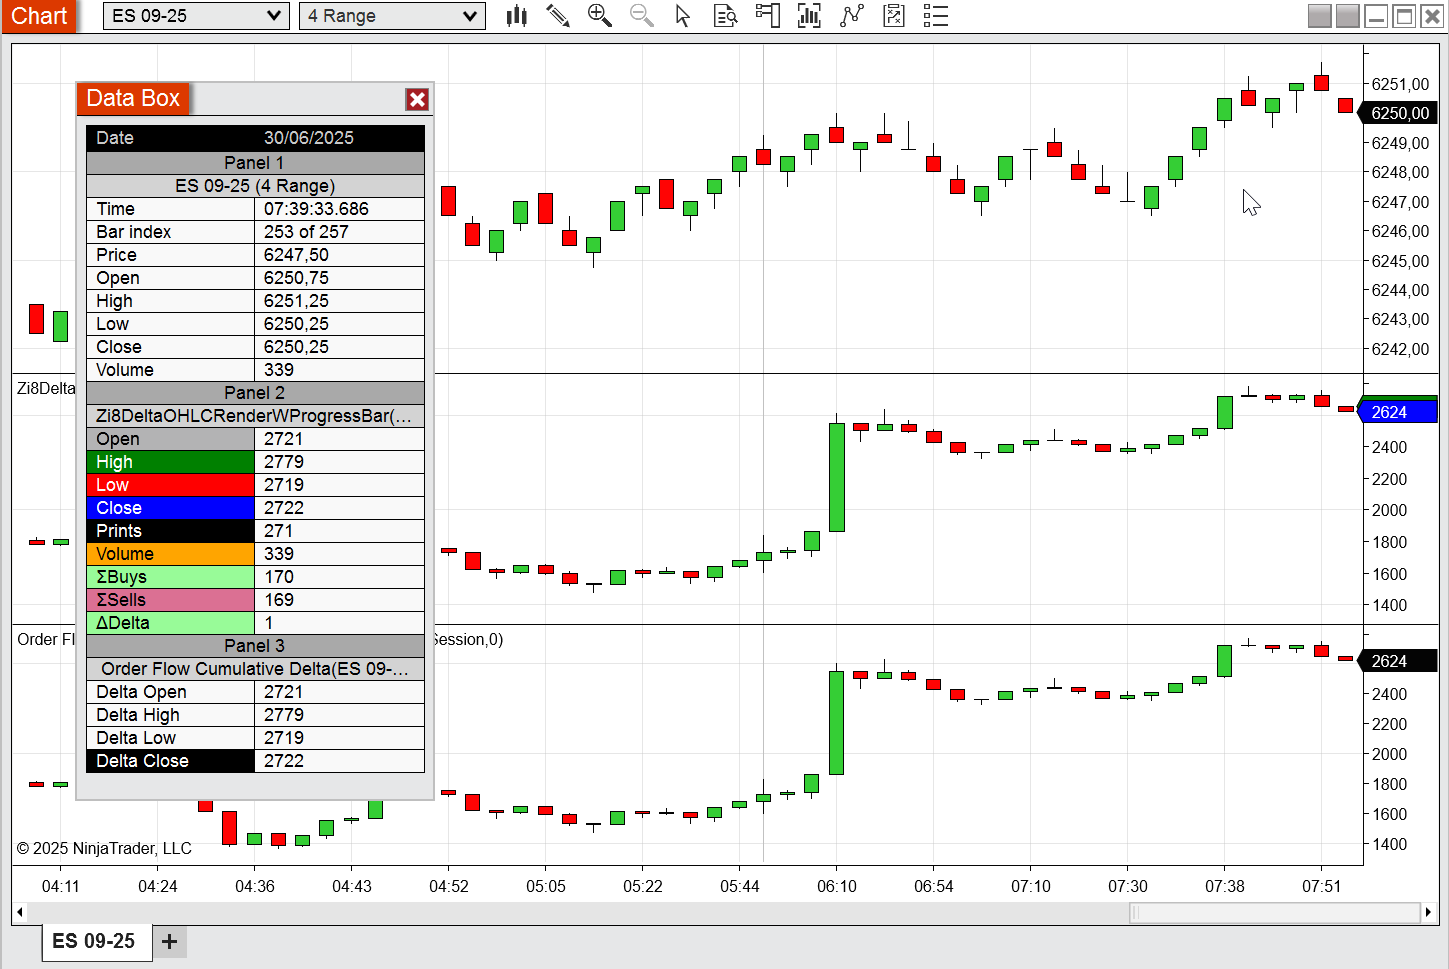
I’m analyzing Order Flow Cumulative Delta on the NASDAQ E-mini September 2025 contract (NQ 09-25) using 100 volumetric bars. I’m using the native NinjaTrader Order Flow Cumulative Delta indicator alongside the footprint chart for reference.
Note:
For the volumetric bars, the delta profile appears to the right of each bar, not within it. Adjusting spacing hasn’t resolved the overlap issue, but that’s a separate concern I’m not too focused on for now.
Core issue:
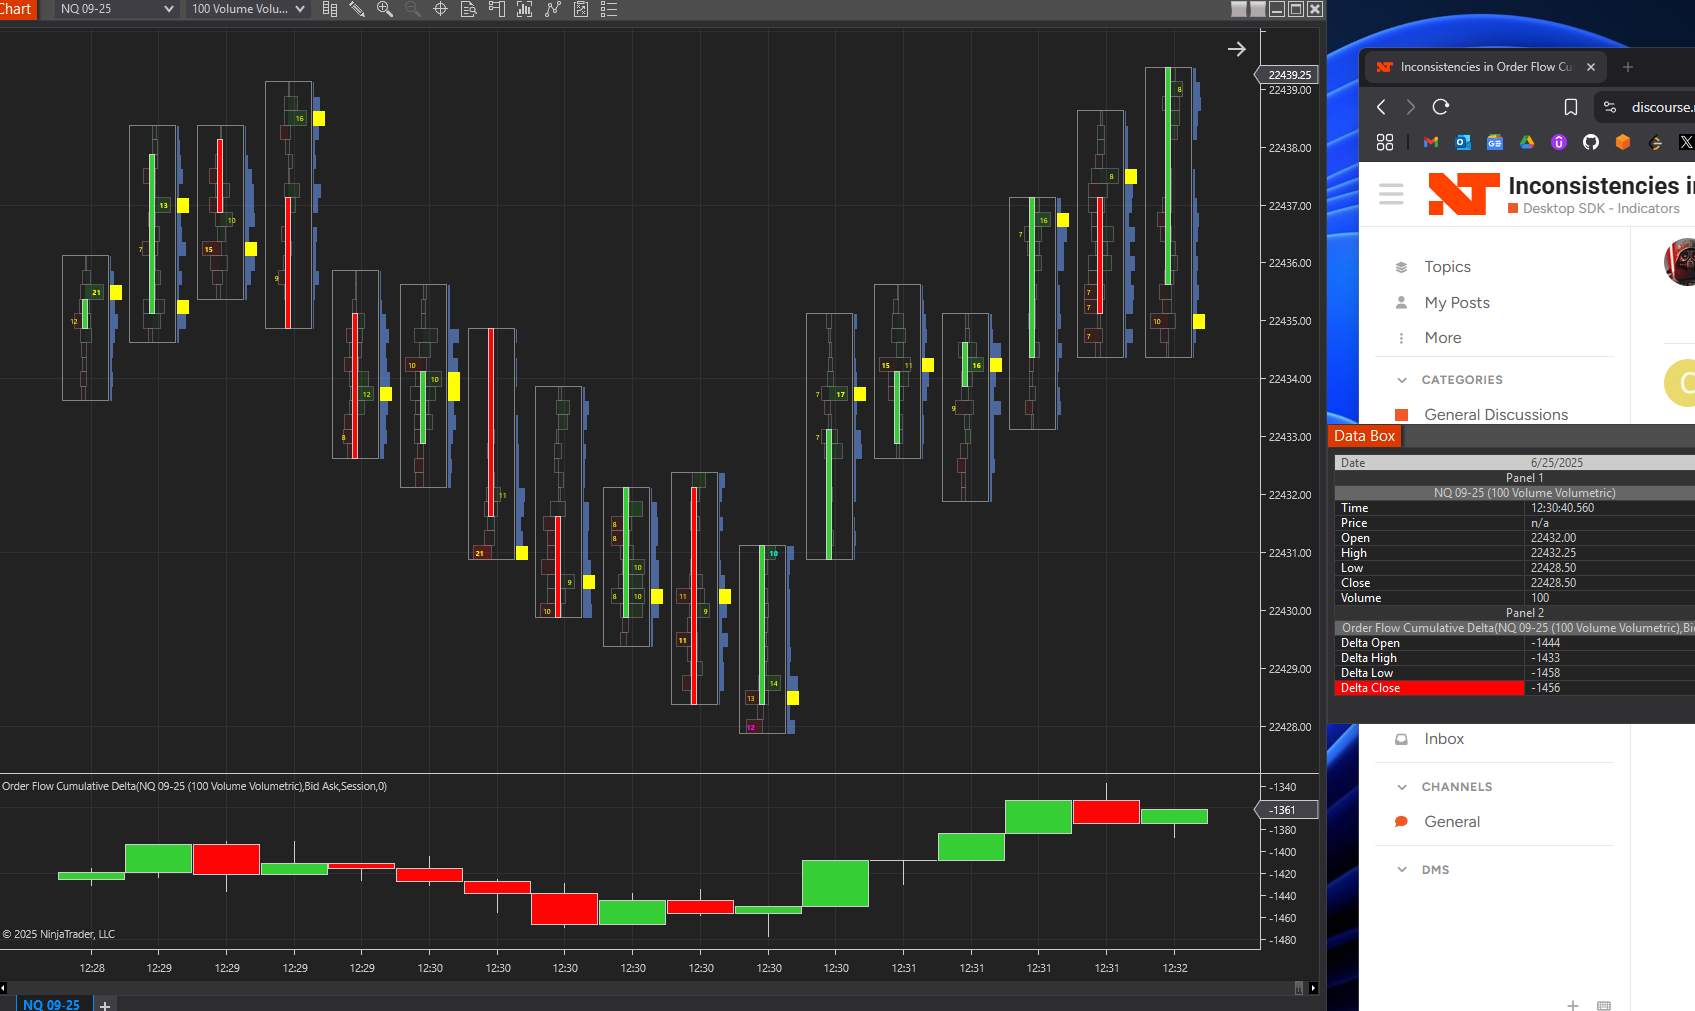
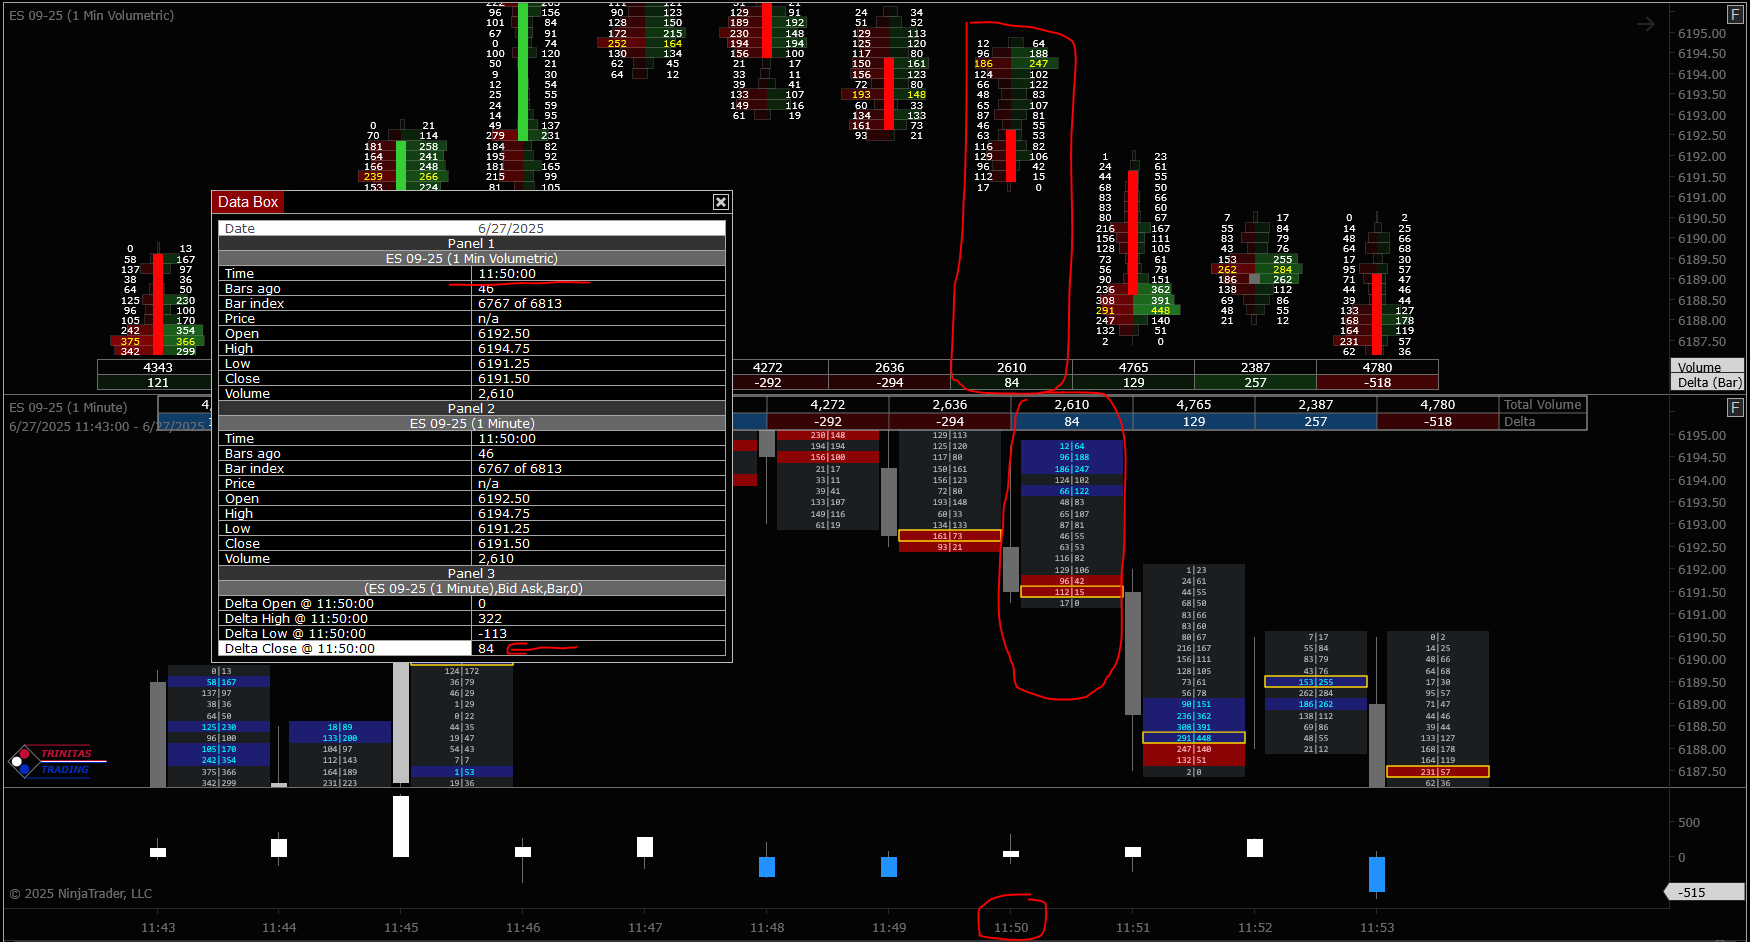
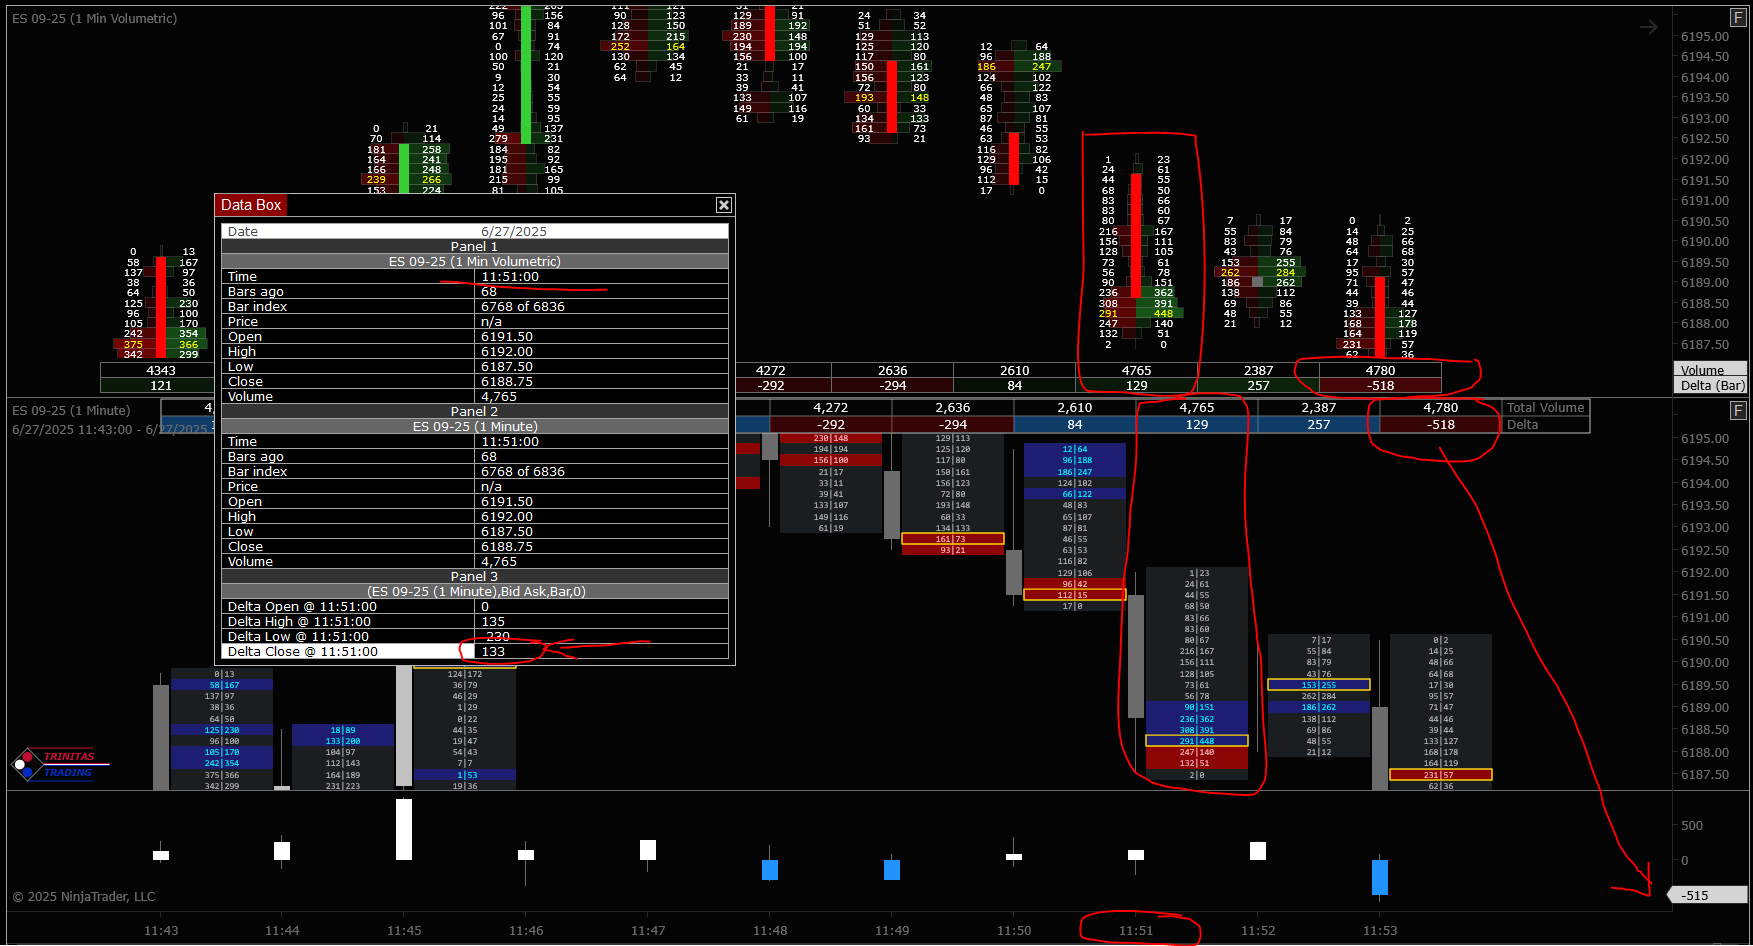
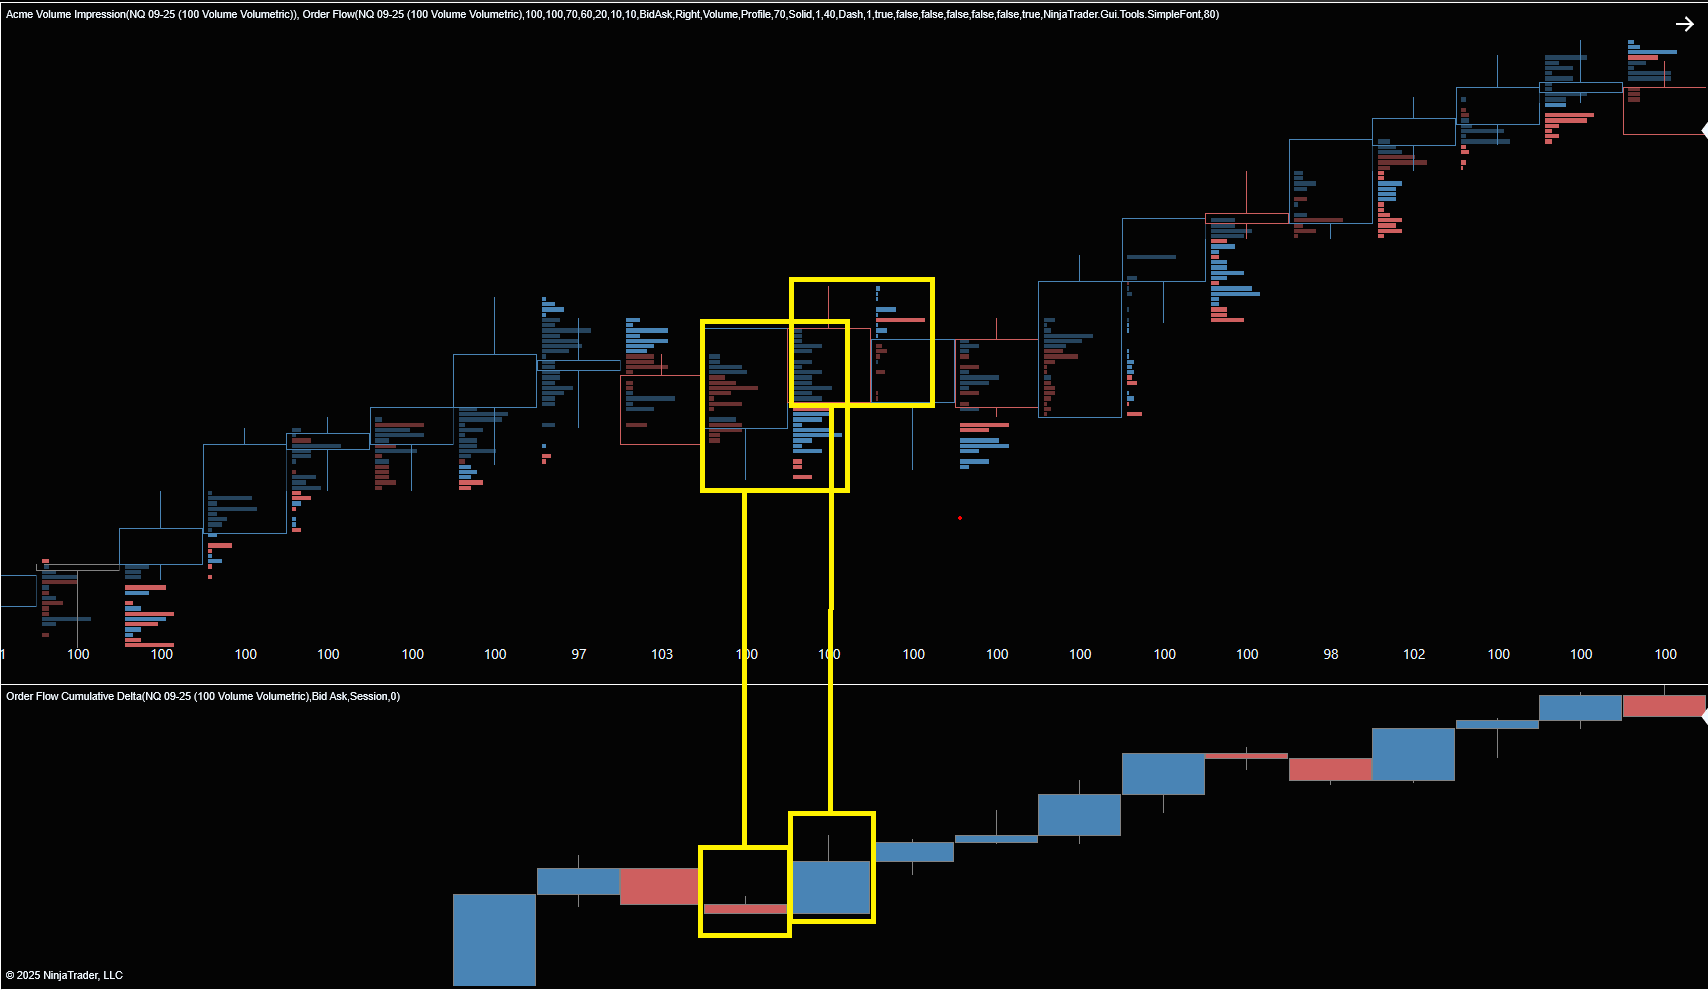
In the attached picture, which shows two examples marked in yellow, the total delta displayed by the Order Flow Cumulative Delta indicator appears inconsistent with what the footprint shows:
Example 1: The first bar shows strong buy aggression in the footprint, yet the cumulative delta at the close of that bar is slightly negative, which contradicts the visual data.
Example 2: The second bar should reflect a more neutral delta based on the footprint, yet the cumulative delta indicates strong bullish aggression, which isn’t clearly visible in the bar-level delta.
Question:
Is this a known limitation or behavior of the Order Flow Cumulative Delta indicator?
Does it calculate based on a different session context, or is it referencing data from a different bar than expected?
Or is there possibly an issue with how it aligns with the delta values shown in the footprint chart?
The attached screenshot shows both examples clearly.
Thanks in advance for any insights.