Hello -
Maybe someone knows the solution with a few button clicks. I’m analyzing 1 minute chart data that I export from NT8. I noticed the raw data does not match the 1m chart data (OHLC). I realized the downloaded data is in UTC and I’m central. What I decided to do then is manually captured the 1m chart data OHLC, and attempted to find this data into the raw file I exported and nothing showed up. I was expecting to have at least the OHLC so I know how much to adjust the UTC time. Anyone know why? Seems like the data is almost useless. But I’m sure its the end user fault. I appreciate any direction you can provide. Thanks.
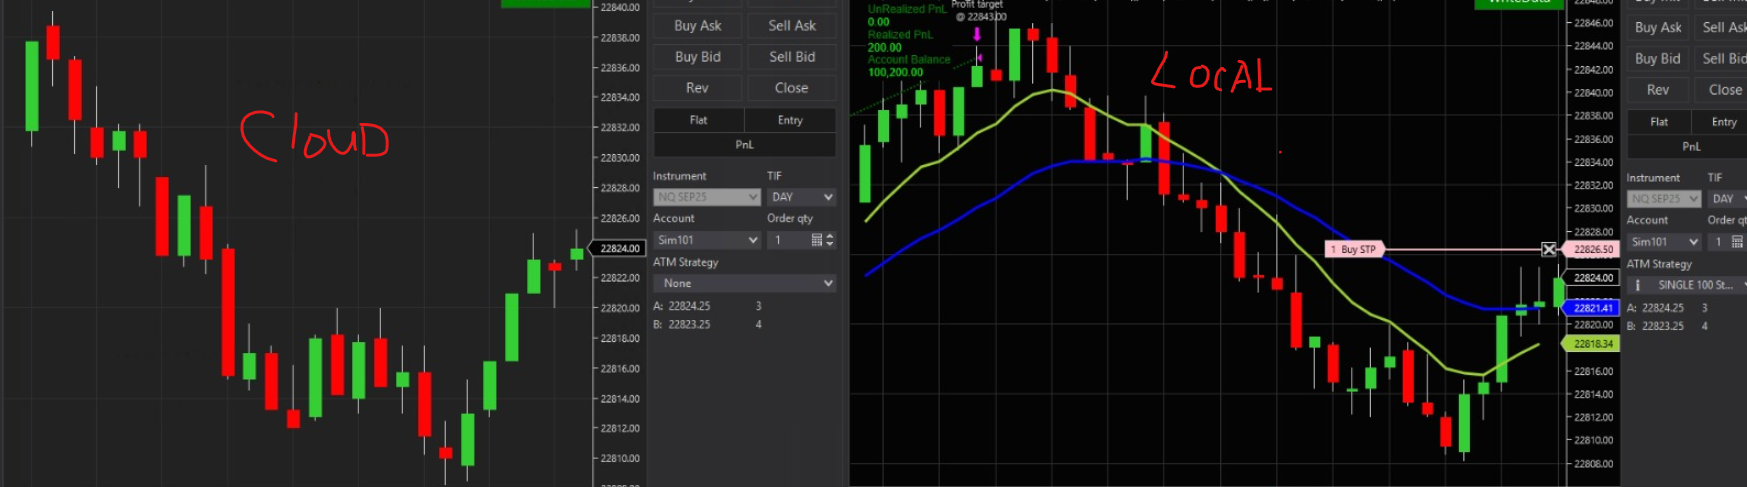
I was tackling a similar issue this week with tick charts and what I discovered (and I could be wrong) is that the quality of the data you are receiving has a huge impact on your charts. I have one machine is local and one on a cloud server and did a side by side comparison of the charts running live data and they were both different. It might not be different enough to throw it off on a 30 minute chart but on a tick chart I would imagine it makes all the difference in the world.
During the same timeframe my local machine was taking automated trades that the cloud machine was not. The cloud machine results were more conservative while the local machine were more erratic.
What I found out was that it was best to get low latency data as close to Chicago as possible to get the most accurate data. If you did want to get access to a VPS, The Indicator Store did an video guide here: https://www.youtube.com/watch?v=knq2AZw_Jig