I’m working on an indicator where plots are drawing continuous lines that extend back through ALL previous sessions on the chart. I only want the plot lines to be visible for the current trading session.
I need to use plots (not draw objects) because the values need to be visible in the data box, have price markers and be accessible to the strategy builder. And it seems the only way to do all 3 is to use “plot” (unless I missed something).
What I’ve Tried (all failed):
- Setting Values[plot][0] = double.NaN for bars not in current session
- Using Values[plot].Reset(barsAgo) when new session starts
- Only assigning plot values when Time[0].Date == currentSessionDate
- Using Bars.IsFirstBarOfSession for session detection
Current Code Structure:
- Using AddPlot() in OnStateChange() for multiple plots
- Calculating values when Bars.IsFirstBarOfSession
- Trying to limit plot assignment to current session bars only
- Lines still appear continuously across all historical sessions
Question:
What is the correct method in NinjaTrader 8 to make plots draw ONLY for the current session and not show any lines in previous sessions?
Looking for specific code examples or documentation references if possible.
Thanks!
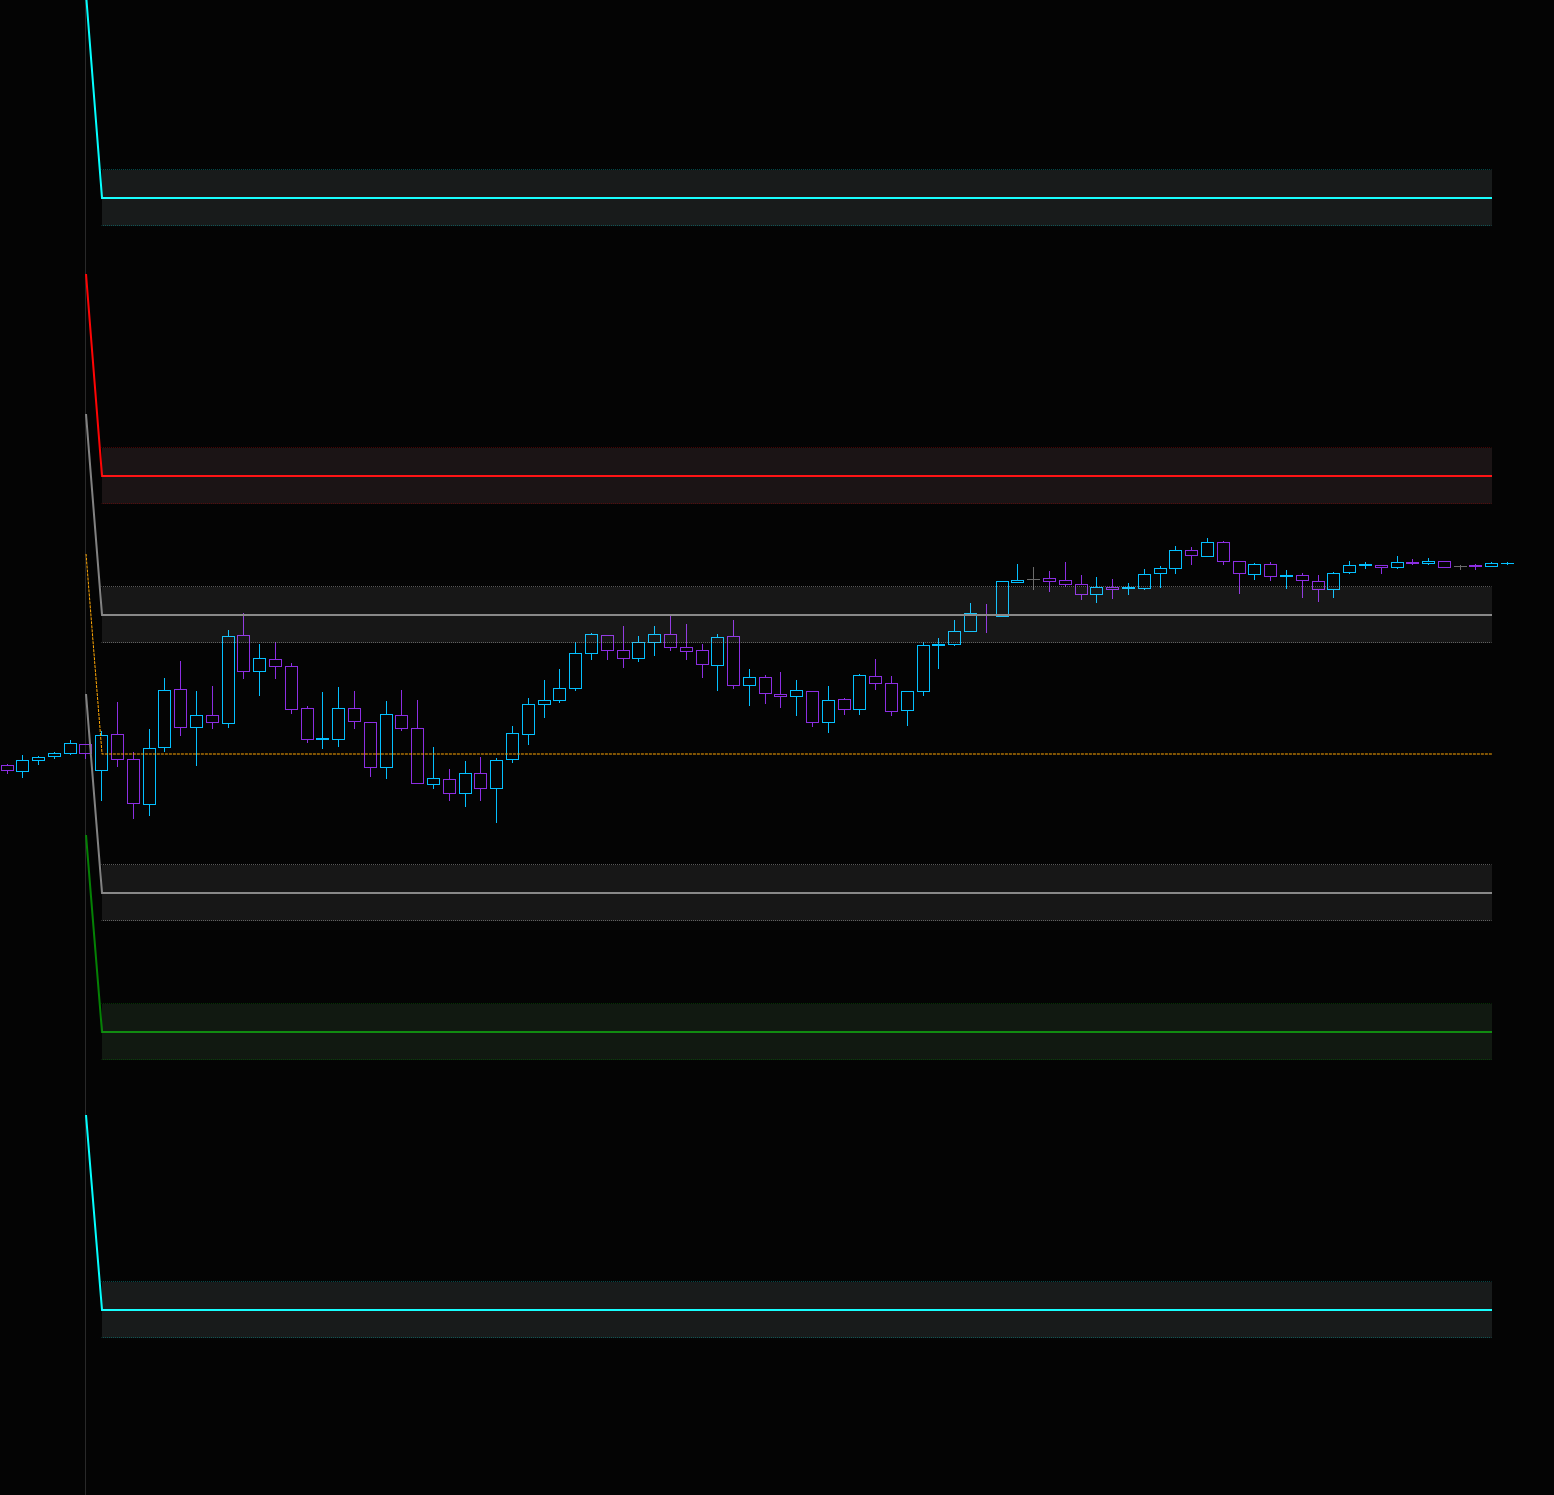
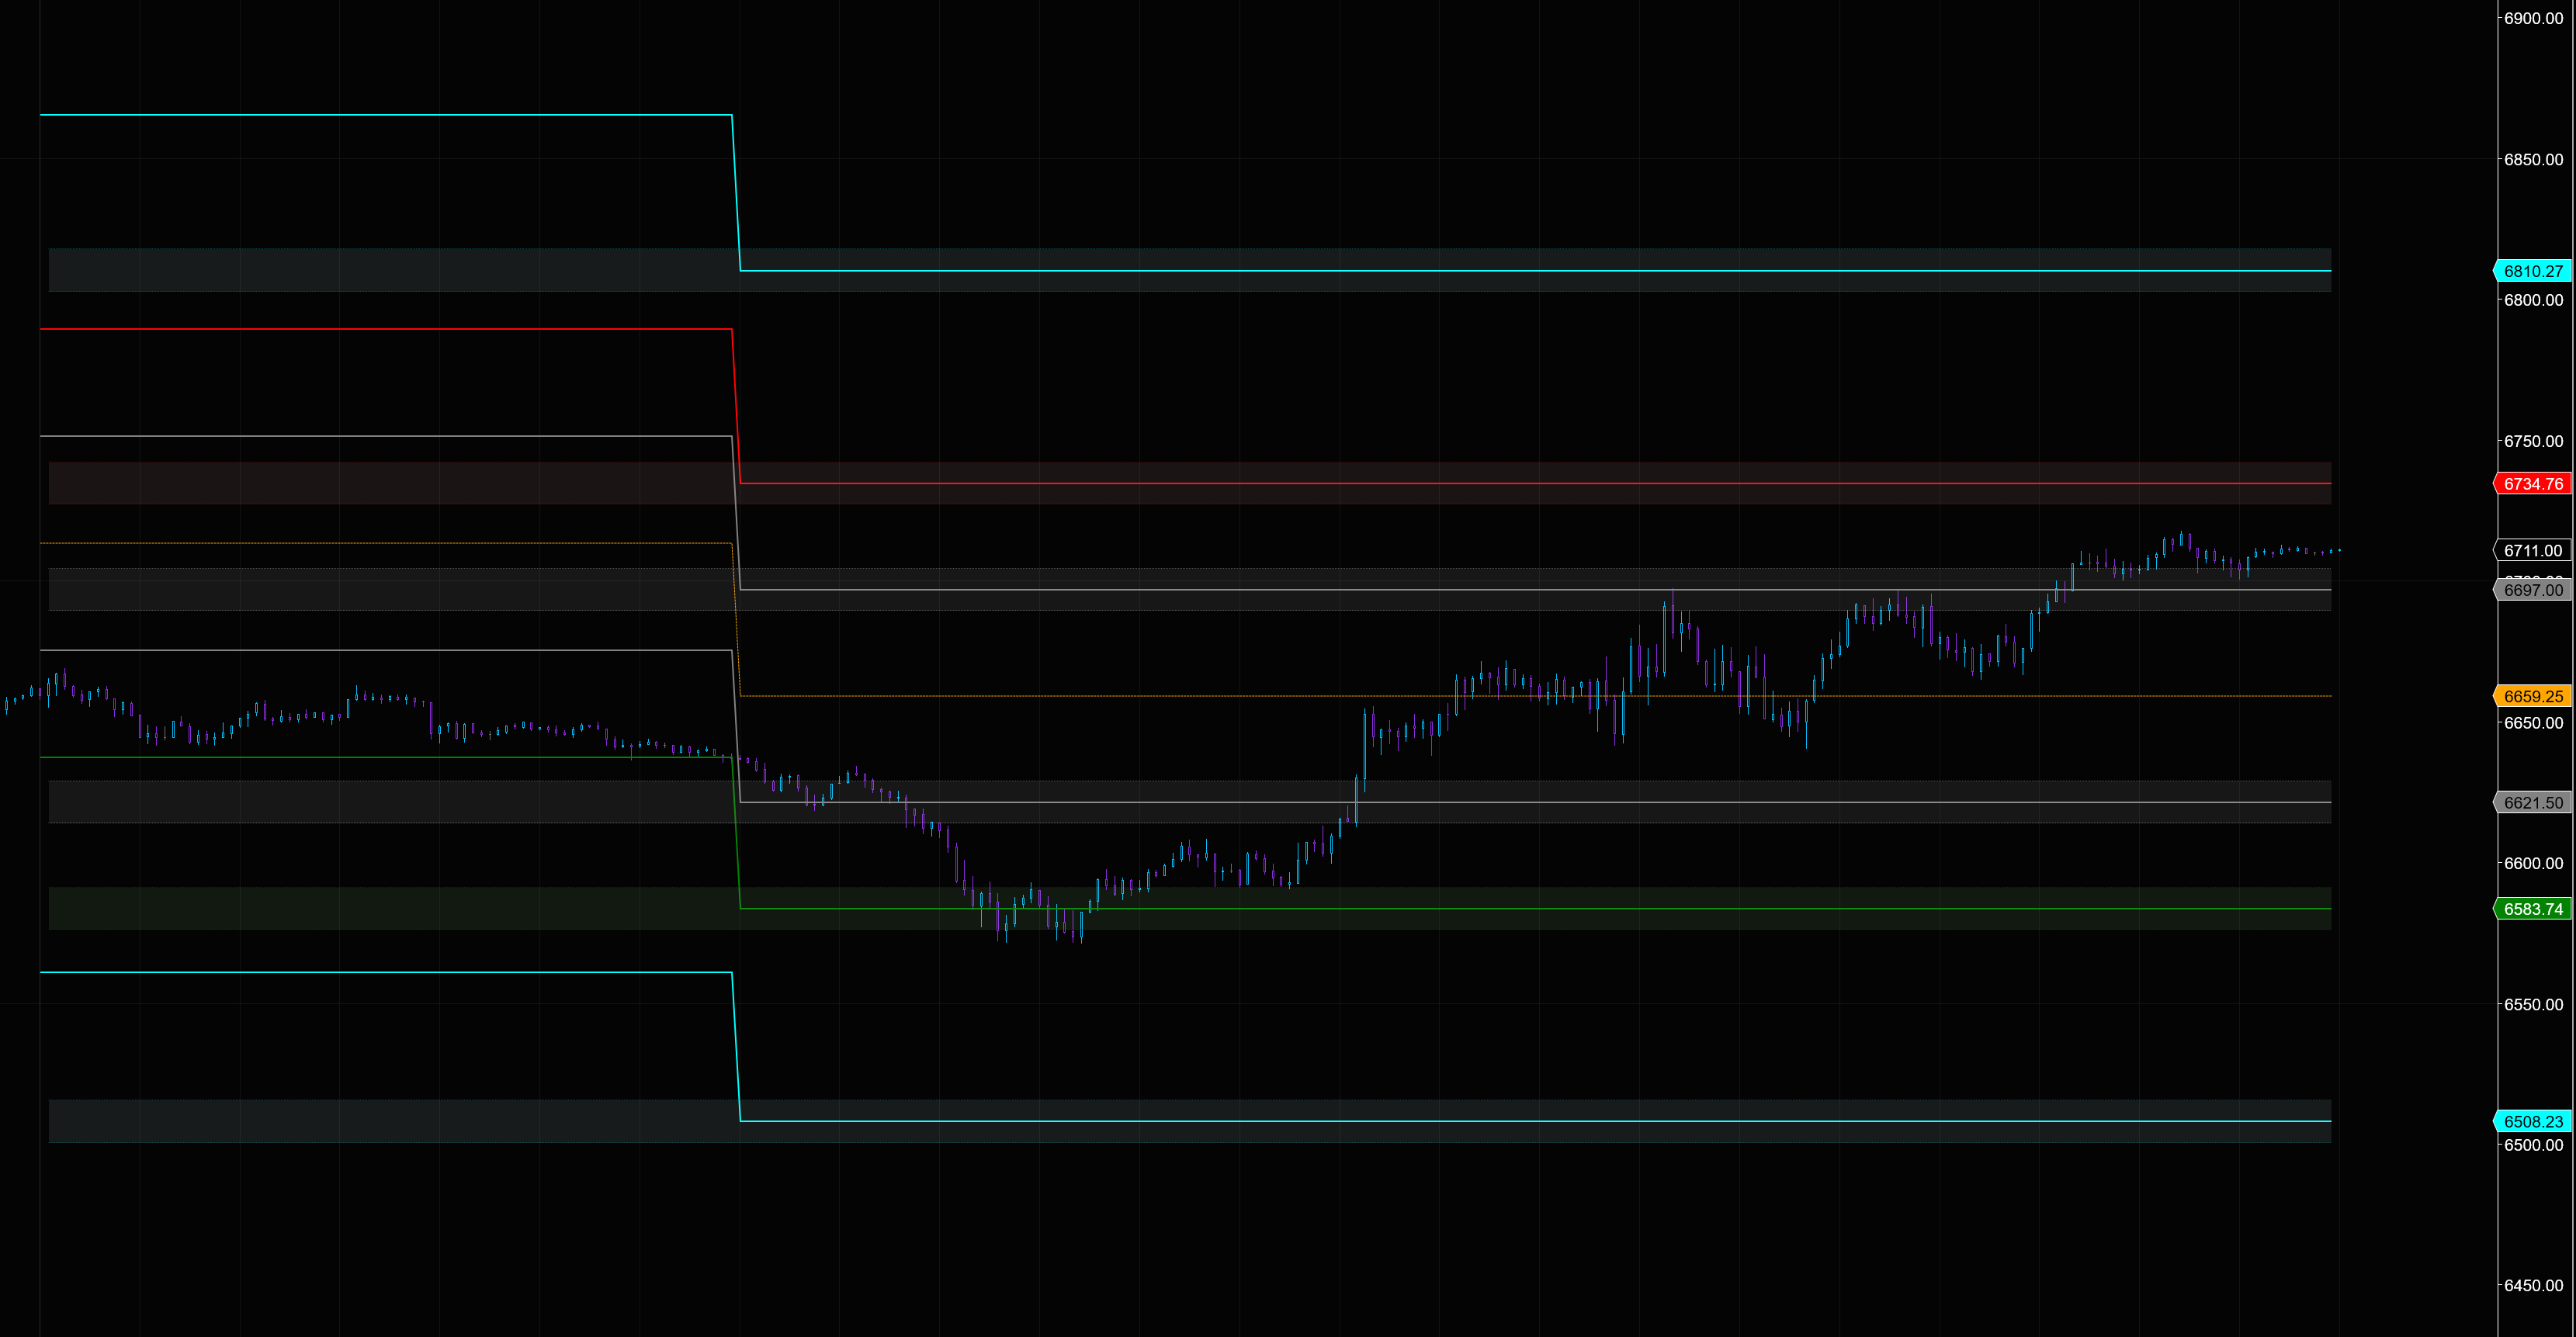
Edit: I was able to make the previous session lines transparent but now I am getting this weird edge/angle line before he new session starts when using RTH.
And its not adjusting properly for ETH