Hello, good day. I used the FVG indicator, but how do I adjust the FVG to perfectly line up to the candles?
It looks on mine like it’s placed every half tick. If a tick is 0.25 pts, it’s placed at 12.5
1 Like
I messed with the indictor’s settings to the best of my ability but to no avail. The indicator has 4 places to make changes: its parameters, data series, setup, and visual. There’re no changes needed on data series, setup, and setup. I checked parameters and nothing there makes a difference. I messed around with minimum ticks the setting is normally at 1, but that did nothing for 1 minute. The candles seemed to be adjusted better if I put 40 on minimum ticks and looked at the chart on 1 hour, but when I’d go to minute with the setting at 40 it would not show all the FVG’s only a couple far back. I guess this isn’t something that can be fixed in the chart. ![]()
I believe it’s how it’s rendering. Maybe it’s intentional. Perhaps emails scripting support and see.
1 Like
I see thank you very much for your insight! ![]()
I looked further into this…
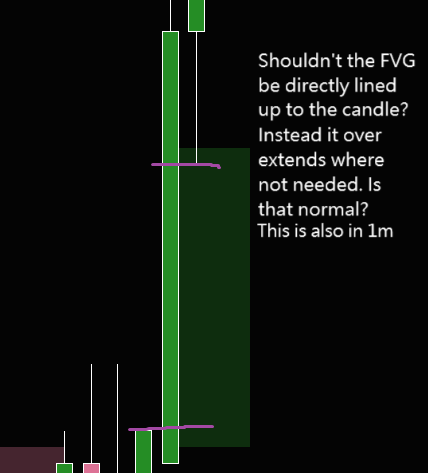
It’s storing every single tick inside the gap into a dictionary and drawing a rectangle on every single tick. So a gap of 10 ticks, has 10 individually drawn rectangles. This allows it have the rectangles end where the prices get filled.
The problem is, when it draws a rectangle for each tick. It only uses 1 price, Yet it needs a top Y and a bottomY co-ordinate for the top and bottom of the rectangle. So it takes the single price and adds half a tick to get the bottom price, and subtracts half a tick to get the top price. This is how it gets a rectangle with a height of 1 tick.
Because of this, the drawn rectangles do not line up with the prices on the chart as bars are whole ticks, not halfs.. A gap that appears from 100.00 to 102.5 (with 0.25 tick increments) would be drawn by the indicator as 99.875 → 102.625. This is why it looks wrong.
1 Like