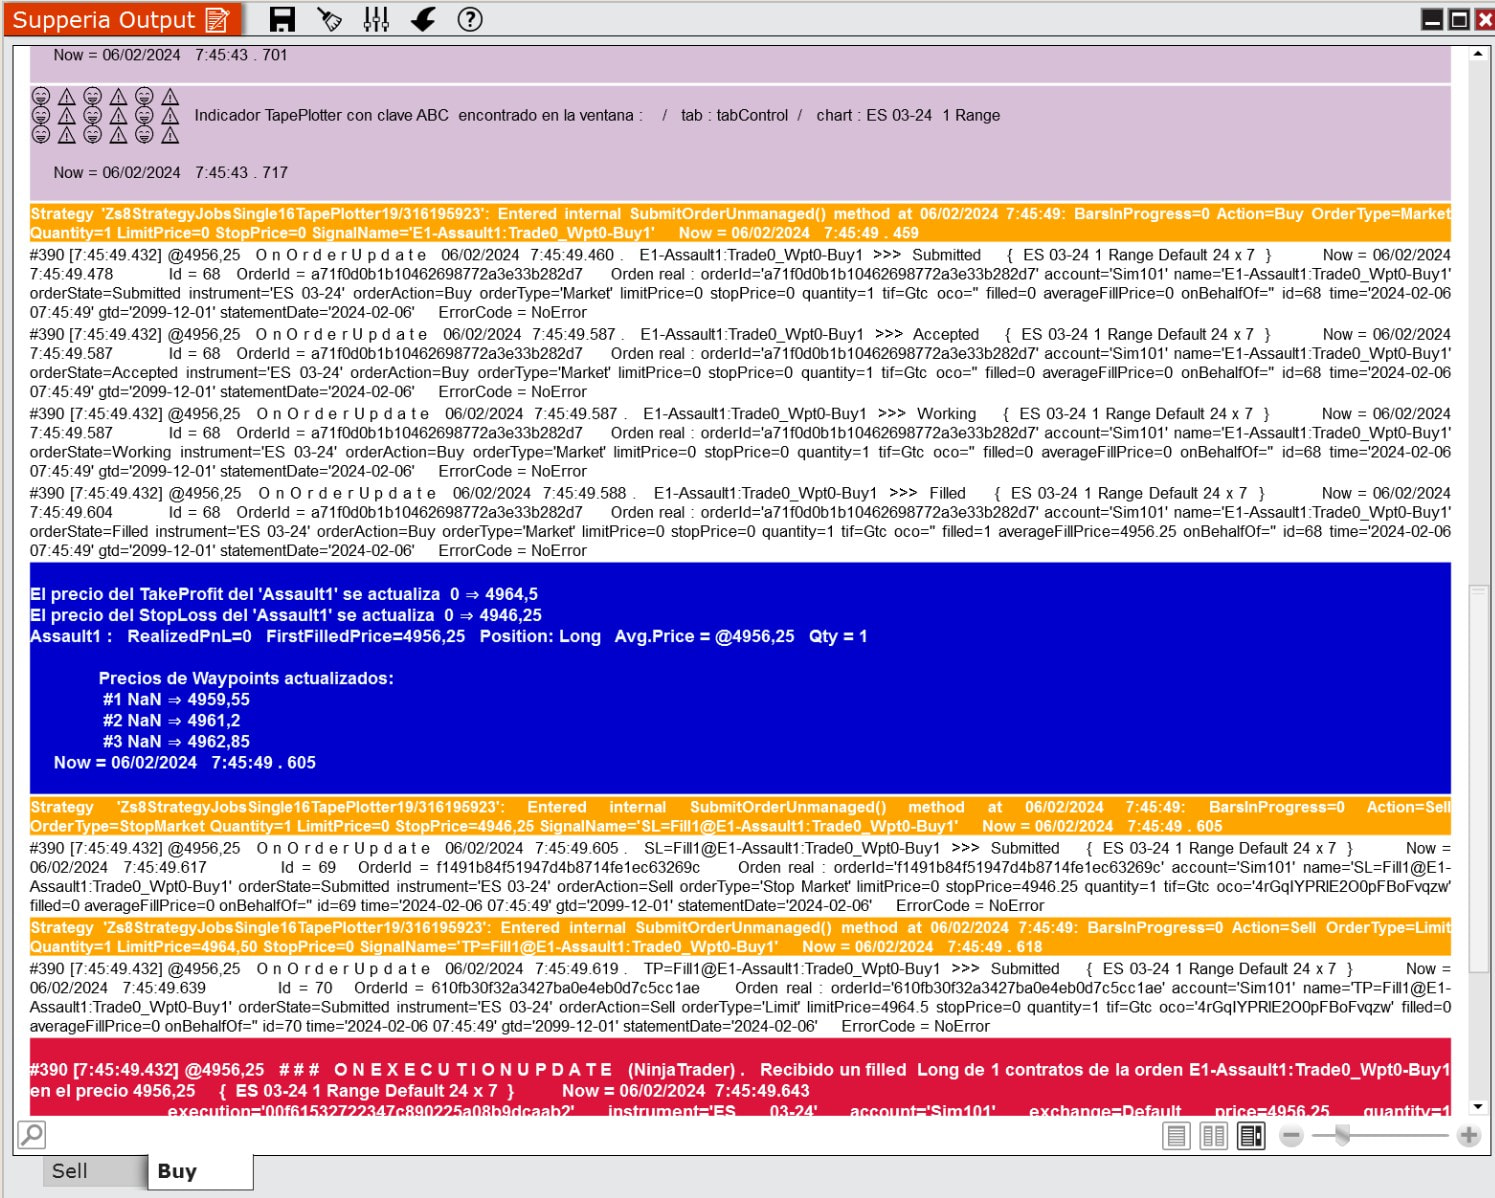
So instead of a wall of text, you can design your debut/output window to give you information that is clear and actionable. Especially if you’re working on multiple strategies and you want to see its behavior and the values and it’s calculation, this is a good approach.
Here’s an example below and as to how to actually do it just ask one of the AI tools.
╔══════════════════════════════════════════════════
║ ORDERFLOW GATE [BEAR] 15:19:48
╠══════════════════════════════════════════════════
║ Trigger price … 7524.25
║ Forming brick low … ~7524
║ Last-closed brick … 3:18:53 O:7528.75 H:7528.75 L:7523.75 C:7523.75
╟── Imbalance ─────────────────────────────────────
║ Buy @ High / Low … 0 / 0
║ Sell @ High / Low … 0 / 0
║ Imbalance count … 0
╟── Ratios ────────────────────────────────────────
║ High bound ratio … 25.86
║ Low bound ratio … 2.29
╟── Efficiency ────────────────────────────────────
║ Buyer (counter) … 0.624
║ Seller (trend) … -1.507
╟── Trap / Delta ──────────────────────────────────
║ Trap state … 1 (BullTrap)
║ Delta Near H / L … 157 / -78
║ Delta Since H / L … -83 / 375
╠══════════════════════════════════════════════════
║ RESULT … FAILED
║ Blocked at … Efficiency slot 1
║ Reason … BuyerEff(counter) 0.624 not < -1.000
╚══════════════════════════════════════════════════