Hi
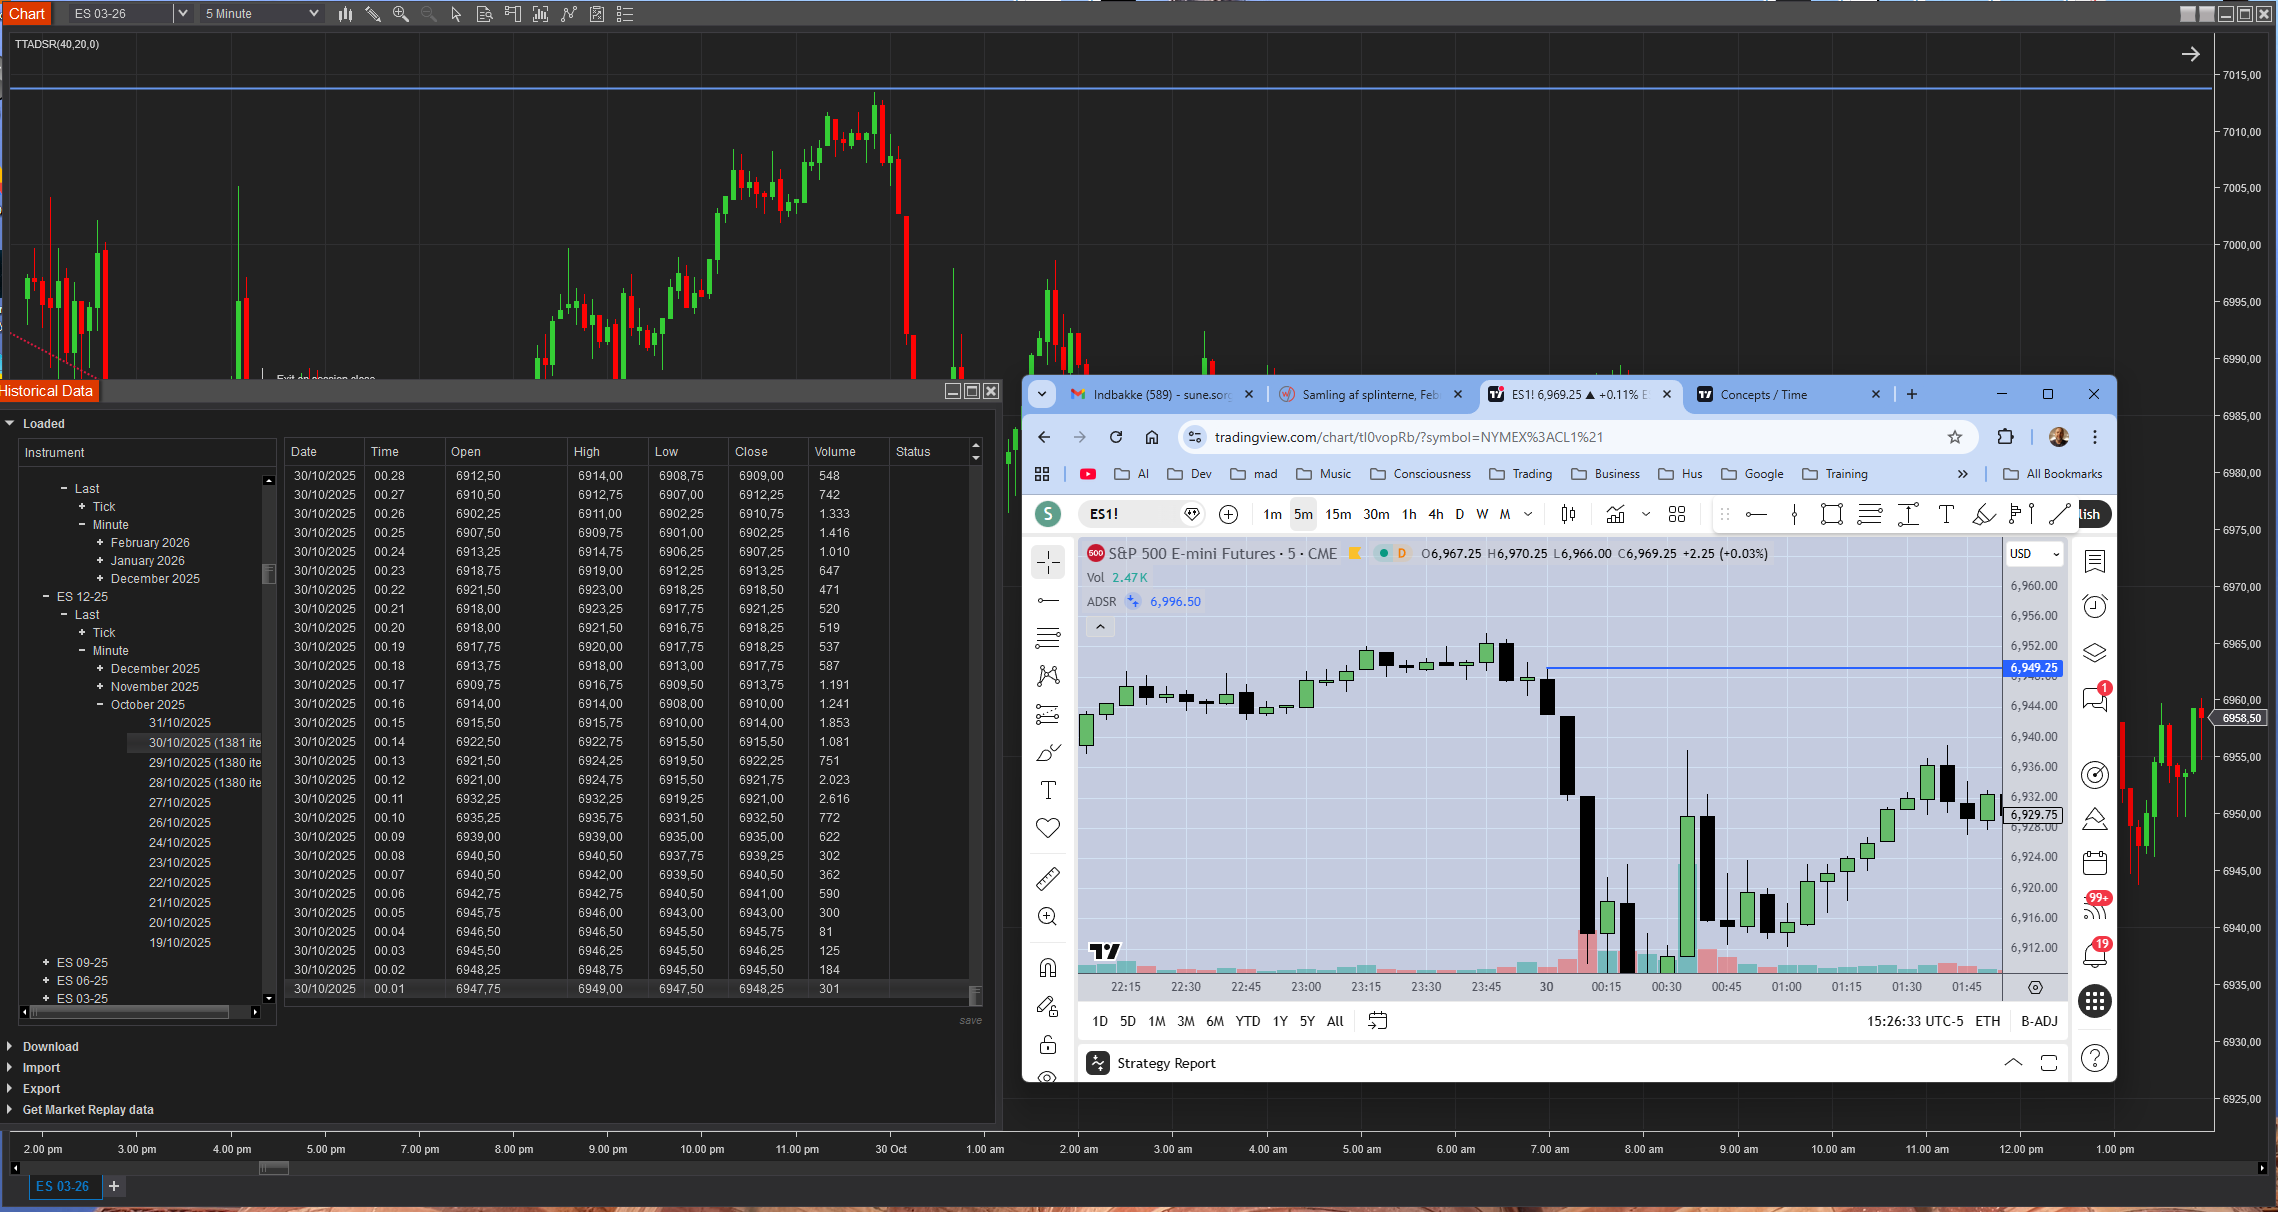
For those of you that use Ninjatrader to backtest take care of possible data errors in the continious contracts. I have found a crtical issue with the ES 03-26 (continious contract) as I am backtesting a strategy on a custom timeframe from 20.10.2025 - 04.02.2026
It seems that data are ok for the “real” timespan of the 03-26 contract but when i go into what woiuld have been the 12-25 contract the data is wrong on the chart by appr. 60 points which seems to be the same data that is fed to the strategy which is bad.
When I look at the historical data for the 12-25 contract they are correct so something must go horribly wrong in the stitching of the contracts.
1 Like
If you backtest, only the data from the last contract is correct. All other data is backwards adjusted. So the data is not wrong, but backwards adjusted. The data for the first quarter of 2026 is at this moment correct, when we go to next period 06-26, the period 03-26 will change too. In continuous contracts the actual period is always correct, and all older periods are backwards adjusted, so not identical to the quotes in the contracts. If prices are not backwards adjusted you will have at the end of each 3 months period a huge gap in prices. Backward adjusting is used to avoid these huge gaps.
The gaps between contracts is caused by the time premium in the contract.
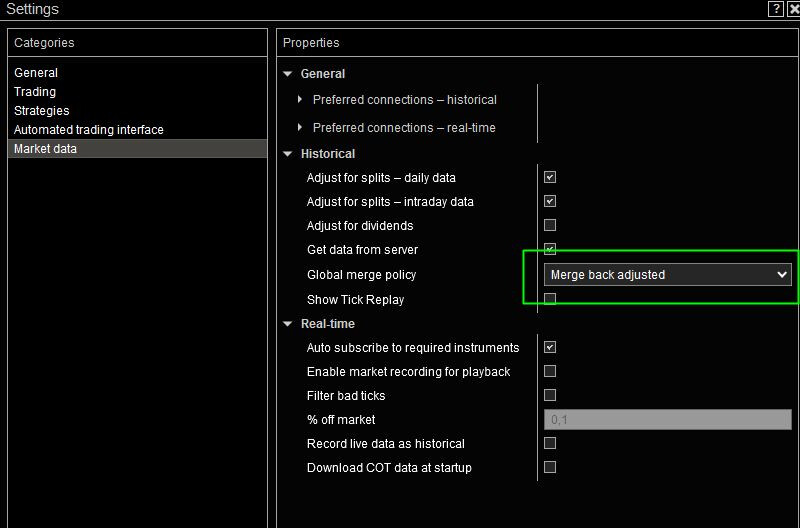
If you want the original quotes per contract, you can change that :
Go to SETTINGS/MARKETDATA and watch in properties. Change them if you wish.
2 Likes
Hi marcus
I was not aware of this way of handling the stitching of contracts. Also I got the same message from the official Ninjatrader support.
It makes sense when you know about it, though none of the other platforms I use do the stitching this way and also provide continious data, maybe they just load the different contracts behind the scenes.
Thanks for your input it solved the puzzle and I got a little wiser ![]()
I use backward adjusted data for many years in backtesting. As I had back then my doubts, I did some tests.
I daytrade, so I don’t know if it works in trading longer timeframes.
I tested my system on the original data, and also on the backward adjusted data. I got the same signals at the same moments. So my system did not have any problem with any of these two.
In backward adjusted data, the quotes are still in proportion just as the original data, they are only at a different level. As they are proportionally “identical” I got the same results.
If you keep trades for a few day, the story can be different.
3 Likes
I keep unadjusted continuous contracts so to see the real levels of support or resistance and supply and demand levels from the past. Keeps it real of pure price action from the past.
JK
1 Like
I forgot to mention that I don’t use any support or resistance levels.
If you need support or resistance levels, you should probably use the data per contract period and not the backward adjusted data.
However: if you trade per contract period (H, M, Z, U), are the gaps that you see on the rollovers not causing problems? Because after the rollovers your price level is different due to the gap of the rollovers.
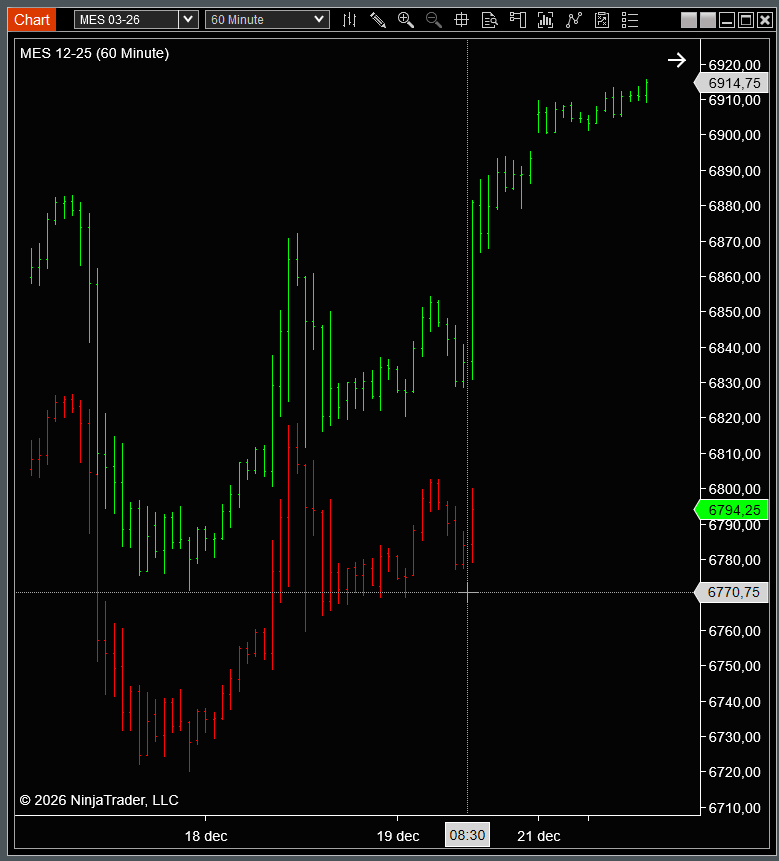
MES 12-25 12/19/2025 close was at 8:30 6794.25
MES 03-26 12/19/2025 close was at 8:30 6847.75
So there was a big gap . How can you draw lines that go thru both contracts?
Red is the 12/25 contract and green is the 03/26 contract.
1 Like
use unadjusted continuous contracts. On ninja I use the “Merge non back adjusted” Go to Tools > Settings > Market data > Global merge policy, select Merge non back adjusted