hello,
i’m looking for a way to show a daily chart how i want. I need to see eth+rth sessions but in the daily chart i want that the open price of candle is the price at 8.30 am utc-5 and the close price at 4.15 pm utc-5 how can i set this ? In the trading hours settings i’m not understading how to obtain this
Not sure if #Marcus’ answer is complete in what you asked (if so, ignore me!)
You want:
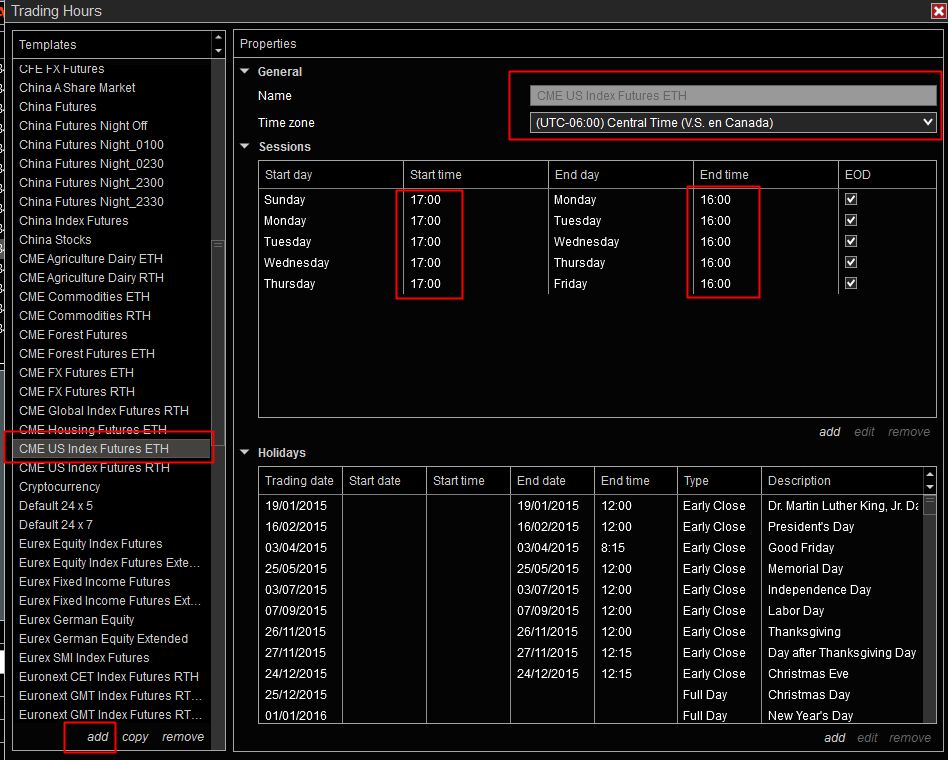
to see complete ETH Session data (for which you need ETH Template)
to see 08:30-16:15 Open and Close (effectively pre-market & RTH Session)
There is no simple and easy way to achieve this oh so basic fundamental platform functionality in Ninjatrader.
Ninjatrader’s recommended solution is to use two Data Series, one with the ETH Trading Hours template attached and a second added to the same chart panel, made transparent Solid Line with the template per #Marcus attached and making 16:15 EOD (to give a vertical time line for Close), and attach Ninja’s Current OHL to this Series for 09:30 Open. If you want Close, use Prior OHLC attached to this Series.
The weakness of the approach is that it requires 2 Data Series in use in the Chart Panel and this additional load can introduce performance issues resulting in chart lag which is a well-documented Ninjatrader Achilles heel. Or it may not.
The alternative using only one Data Series requires Add-ons - Ninja, User-shares or 3rd-party and how you choose to go about it depends on what/why you want? (e.g. just visual, or do you want Open & Close values programmatically to feed something else such as a Strategy). Visual can be done with Add-ons such as Colored Zones, Repeater etc through to 3rd-party Sessions indicators
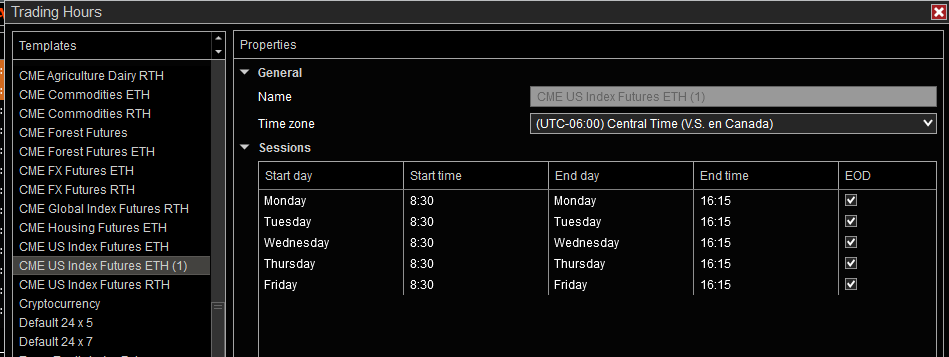
I did not create the new template that was asked in the original post, but my test would work exactly the same way.
So 2 different templates without any problem. It should work also with a newly created template.
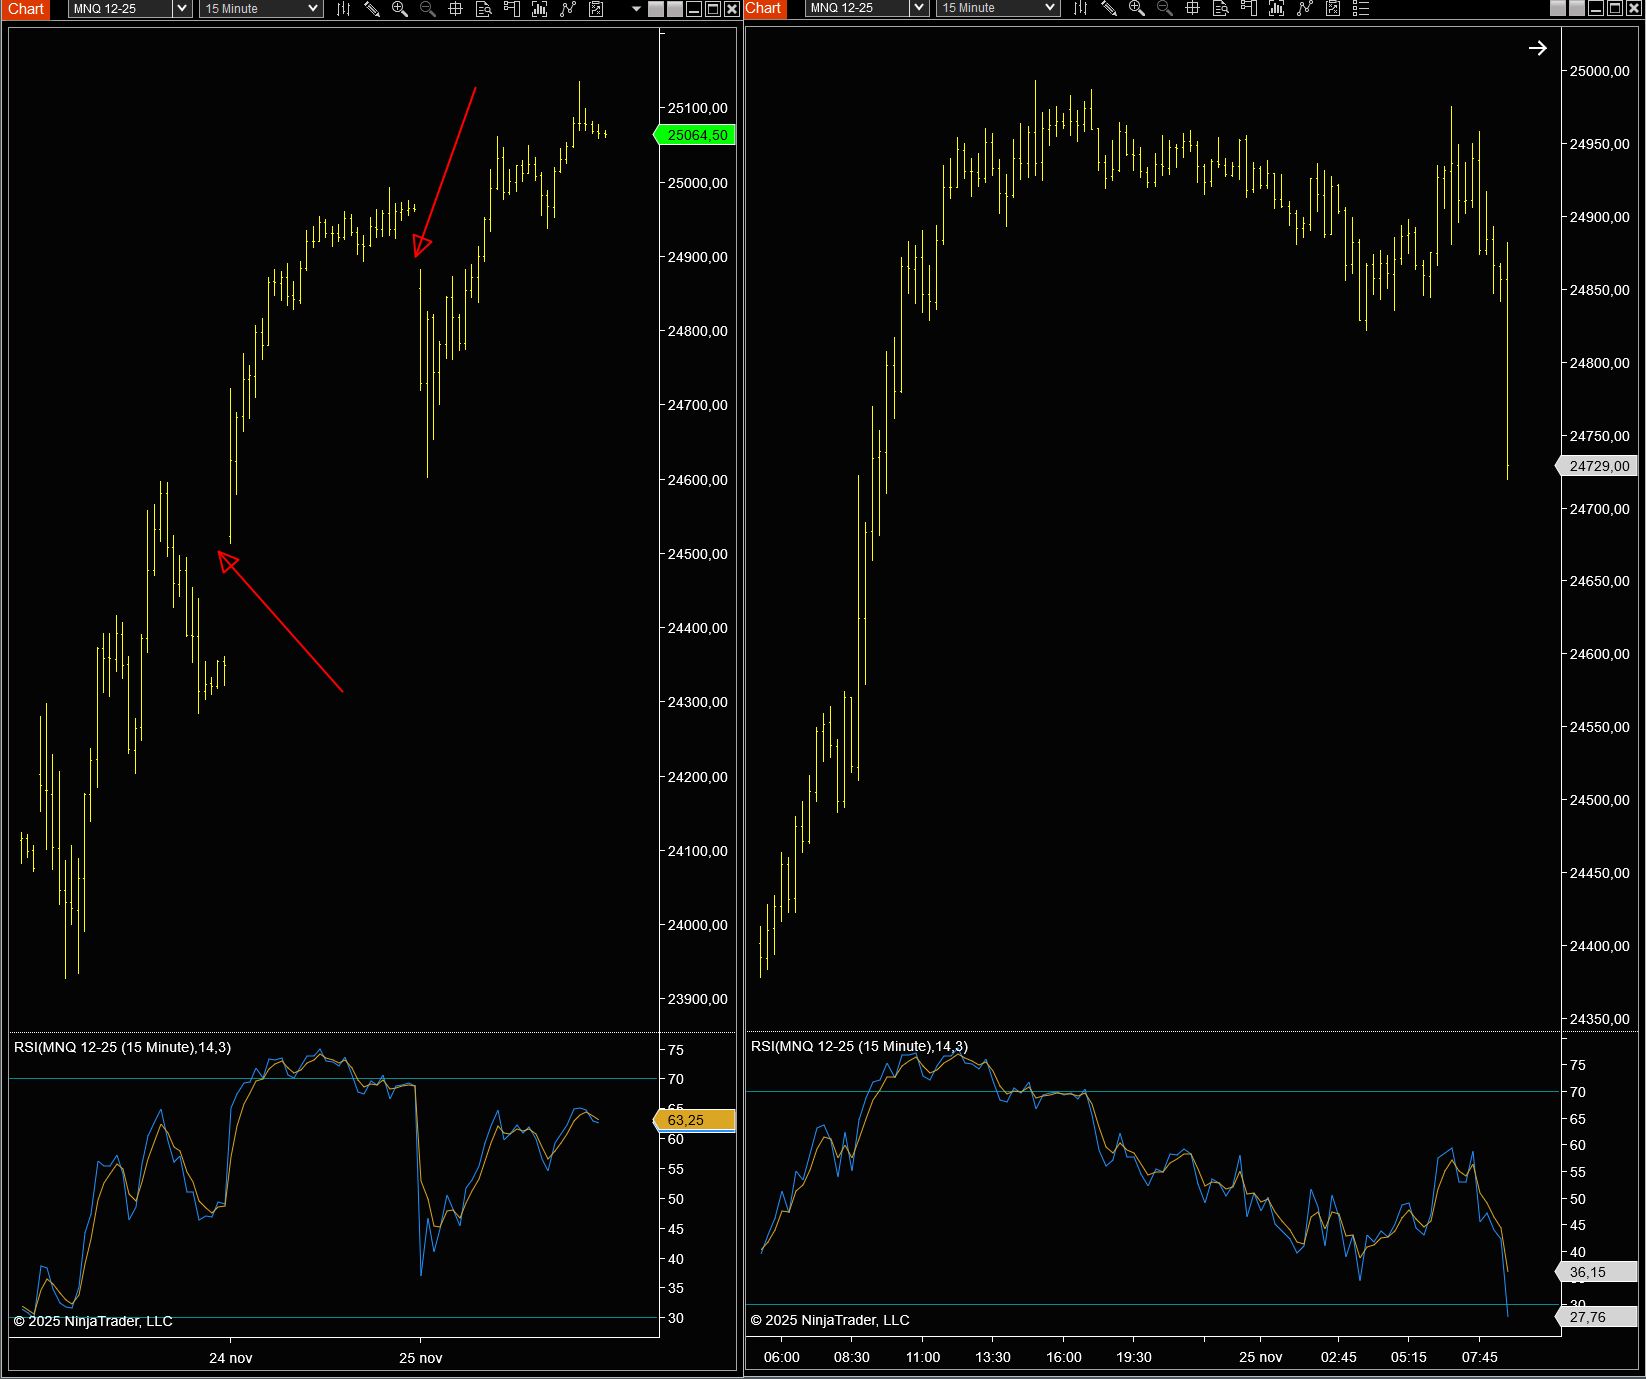
You cannot bring all this together in 1 chart as it would create gaps in the prices and indicators will not work or be represented correctly. But if the purpose was to have 2 different templates it is logical that all indicators then also use the correct data, which is different as RTH is not equal to ETH.
The red arrows indicate the gaps because of using RTH instead of ETH.
i need this only in daily chart. To better explain you can see the daily chart on tradingview. I’m living in italy and time zone is utc+1. Cash opens at 3.30pm and close at 10.15 pm. Using default instrument trading hours on ES daily chart the open price is the price at 0.00 am but i want that open and close price should be like trading view
My bad, on re-reading I’m also not sure what you want. You said you want ‘a chart’ with ETH & RTH so assume want both in same single chart, but is ‘daily chart’ ‘Daily Bars’, or intraday lower time frames?
Suggest (per #Marcus) you post a TradingView screenshot of what you want/have
Best,