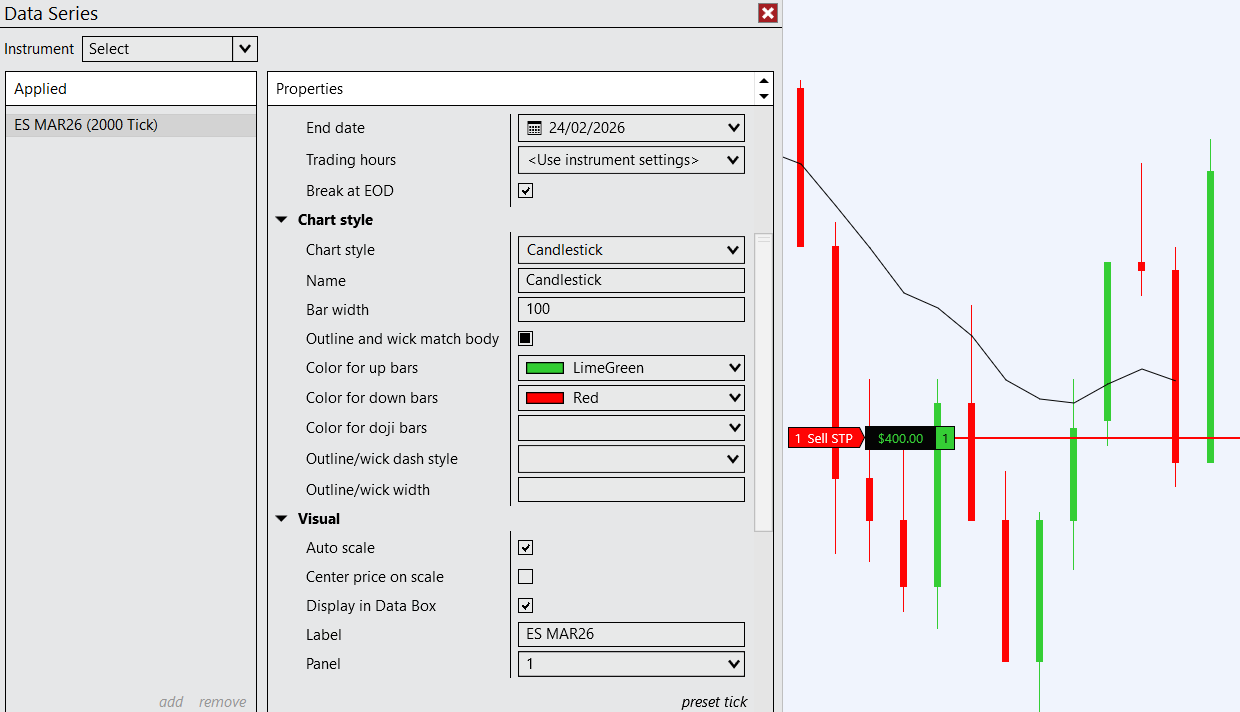
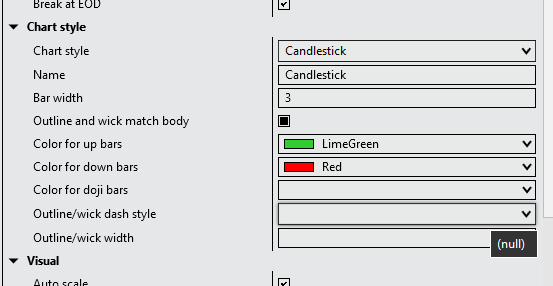
I finally upgraded but have some issues. Mostly, the candle stick settings don’t seem to work at all. There’s this weird black mark in the checkbox for ‘outline and wick match body’. Bar width setting doesn’t seem to work, either does ‘outline wick dash style’ or ‘outline wick/width’ so I’m stuck with this weird settings.
Anyone else with these issues? Can you check please, the issue only becomes apparent if you try to change candlestick settings, which you might not have done for a while.
Right, I was doing that but after a while they mess up again and you therefore constantly have to reset the template. I’m not sure what triggers the error though sometimes I can repeat it and sometimes not.
Same for me. Can’t uncheck the “Outline and wick match body” button whenever the bug hits. I’ve tried to replicate consistently, but no luck. It strikes at will, typically with a change and reload of a bar series. (I emailed support today)
Also, found a bug in the new Time Highlighter, the Opacity for a second highlight doesn’t work, it’s set to the first highlight’s opacity.
This bug just bit me during rollover. All my charts reset to the default colors and I had the “outline and wick match body” check box problem as well.
One thing I noticed is that when this happened, the “color for doji bars”, “outline/wick dash style”, and “outline/wick width” properties are now all reporting null values. If I try to manually set those properties to meaningful values, they reset back to null when I click apply.
I sent an email to support and will post the results when I get them.
I think support don’t know a solution, they just told me to reload historical data.
I have the bug re-occurring all the time but I’m still unsure of the exact pattern to repeat it. Often happens when changing intervals or things like this.
I’m not surprised support gave you a generic workaround. When it happened to me I was able to restore my settings using Donk’s solution. I’m curious, does the support answer of reloading the data fix it for you? It would also to be interesting to know if anyone else gets this problem when they perform rollover. When it happened to me I had:
manually rolled over in my primary workspace using the database management function in the control center.
switched to my coding workspace and received the automated “you need to rollover” message from NT.
I selected ok do it and bam! my chart was hosed.
interestingly, when I switched back to my primary workspace all of those charts were broken as well.
I’ve tried playing around a bunch with changing intervals and instruments but have yet to be able to reproduce the problem. Maybe if enough of us complain support will take the time to really dig into the issue.
Here’s the response I got from support. It’s lackluster as expected. They seem to recommend the same workaround that Donk posted: using the preset/restore.
Hello,
Thank you for the inquiry.
Since you mentioned that you updated recently, this issue can sometimes occur when using either a chart template that was created before these options were available (newly released in 8.1.6.3) or when using a chart interval custom preset that was similarly saved before these features existed. Very rarely it can be caused by 3rd party addons if they change the chart template or candlestick settings for you, but most often it is a chart template or preset function.
One way to work around this would be to select your chart interval preset at the bottom of the Data Series window and click “preset>restore” to restore the saved custom default visual settings back to default. Another option to try would be to open a fully blank new chart with no chart template applied and see if the issue still persists.