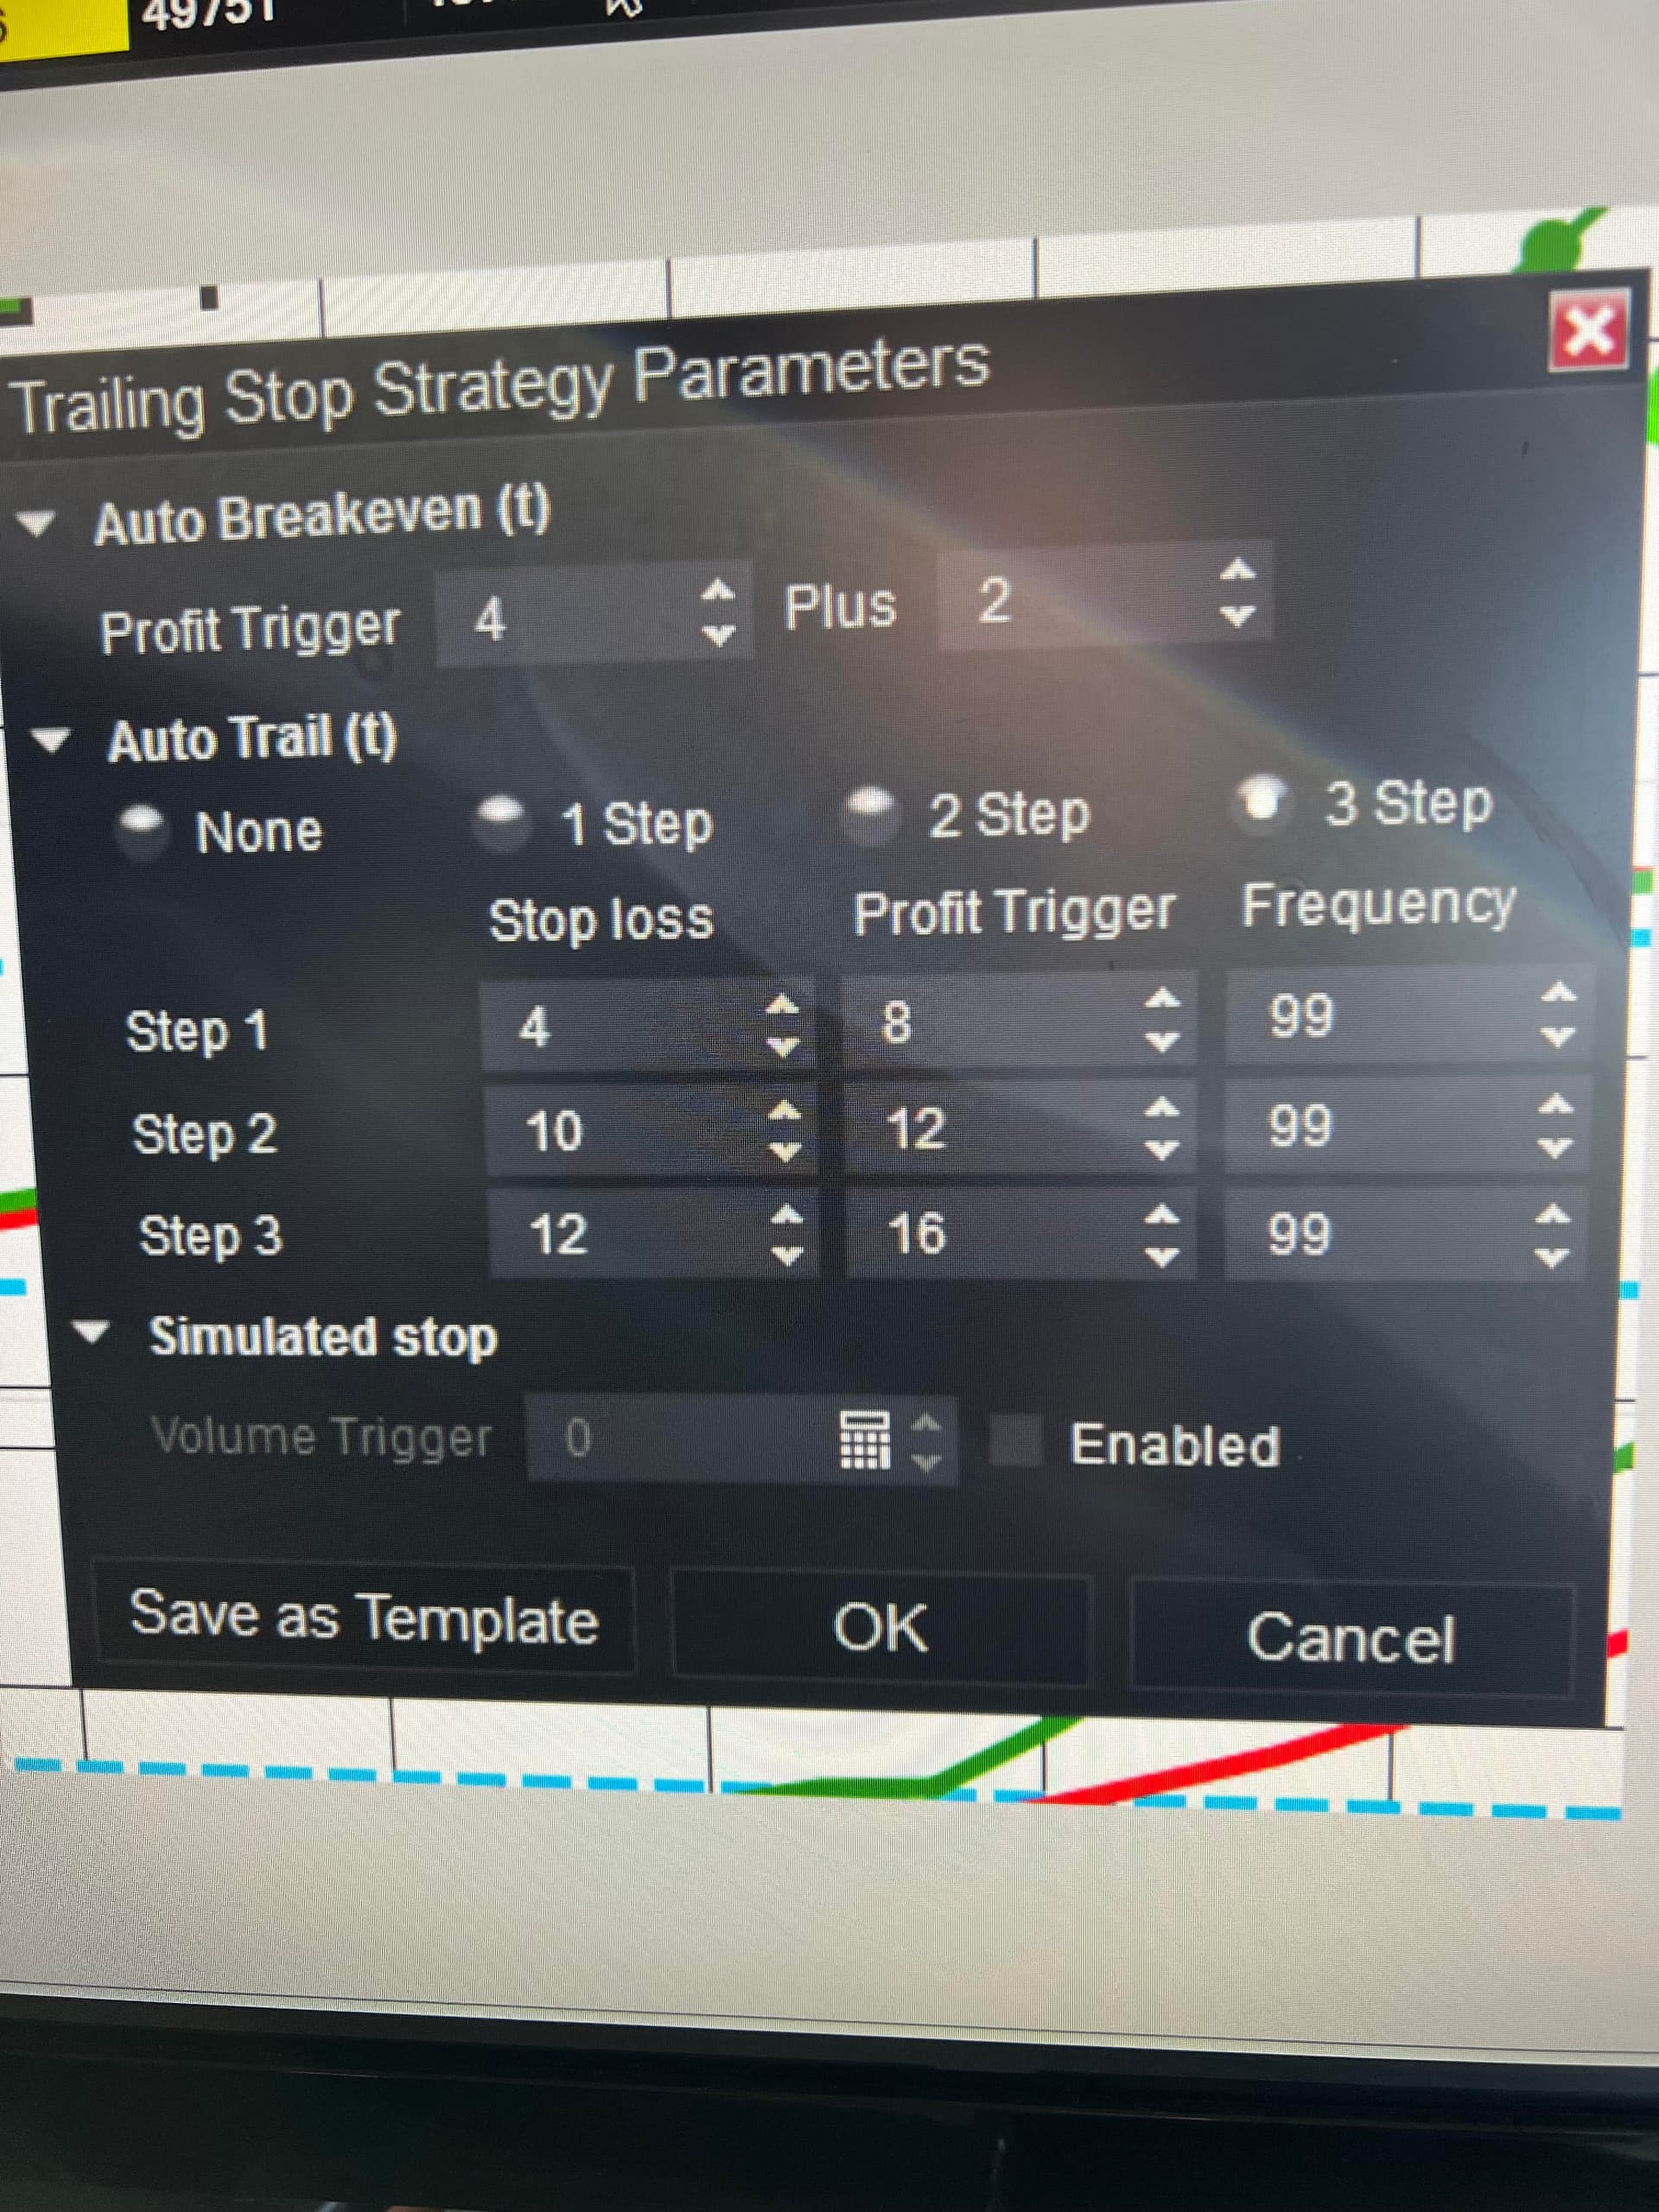
Hi everyone … I would like to make sure that I have setup this NT strategy correctly (see attached picture)
Auto breakeven: If I go long on the ES at 6950, the auto breakeven will move to 6950.50 when the market hits 6951.
Step 1: Once the ES goes to 6952, the stop goes to 6951
Step 2: Once the ES goes to 6953, the stop goes to 6952.50
Step 3: Once the ES goes to 6954, the stop goes to 6953
I would appreciate anyone’s help in confirming that I have set this up correctly.
Experiment by using Sim101 and Market Replay (aka Playback connection) or use the Simulated Data Feed.
I’d recommend you study how to use the Simulated Data Feed and then open a position using the ATM and then watch what NT does.
The only thing to understand about the Simulated Data Feed (all ticks are fake, you set the directional trend by adjusting a slider bar) is the chart’s Trading Hours should be set to ‘Default 24x7’. Why? This allows the Simulated Data Feed to work on weekends, because fake ticks are only generated during the hours specified by the chart’s Trading Hours template – just use ‘Default 24x7’ when you play with it and you’ll be fine.
Set the slider to rise and test your ATM in a LONG trade. Then change the slider so price falls, and test a SHORT trade.
For testing ATM strategy settings, the Simulated Data Feed is perfect. It’s a very fast way to check your ATMs by seeing them in action.