Add-On NT8 DOM Built with Claude. (AMA)

Built a custom orderflow ladder as a standalone NT8 AddOn, runs in its own window, completley independant of the SuperDOM. Fixed-price grid that tracks every tick buy/sell across a sliding window and the full session. 12-state structural classifier identifies absorption, degradation, exhaustion, sweeps, alignment at each price level in real-time. Volume profile heat map, diagonal imbalance detection, session reference levels (POC, value area, IB, prior close, session open). Integrated order managment with 5 order types, armed triggers that fire on structural conditions, and ATM support. ~7,200 lines of C#.

Ask me anything about how you can build it yourself, I can provide some documentation and guidance.

4 Likes

This Looks Great, very nice orderflow ladder

2 Likes

Maverick,

Rather than me trying to reinvent the wheel, are you able to provide your existing source code so that I can explore the possibility of adding or mapping results from strategies to the 12 structural data exposed by the AddOn ?

For example, a confluence strategy that triggers Reversal (tails+ exhaustion and negative POC and Level2 spoof) at one or 2 price levels ?.

This trigger from a strategy can then be mapped to any features of the DOM AddOn.


You asked the same question i’d ask, though here’s how I started communicating with Claude about this:


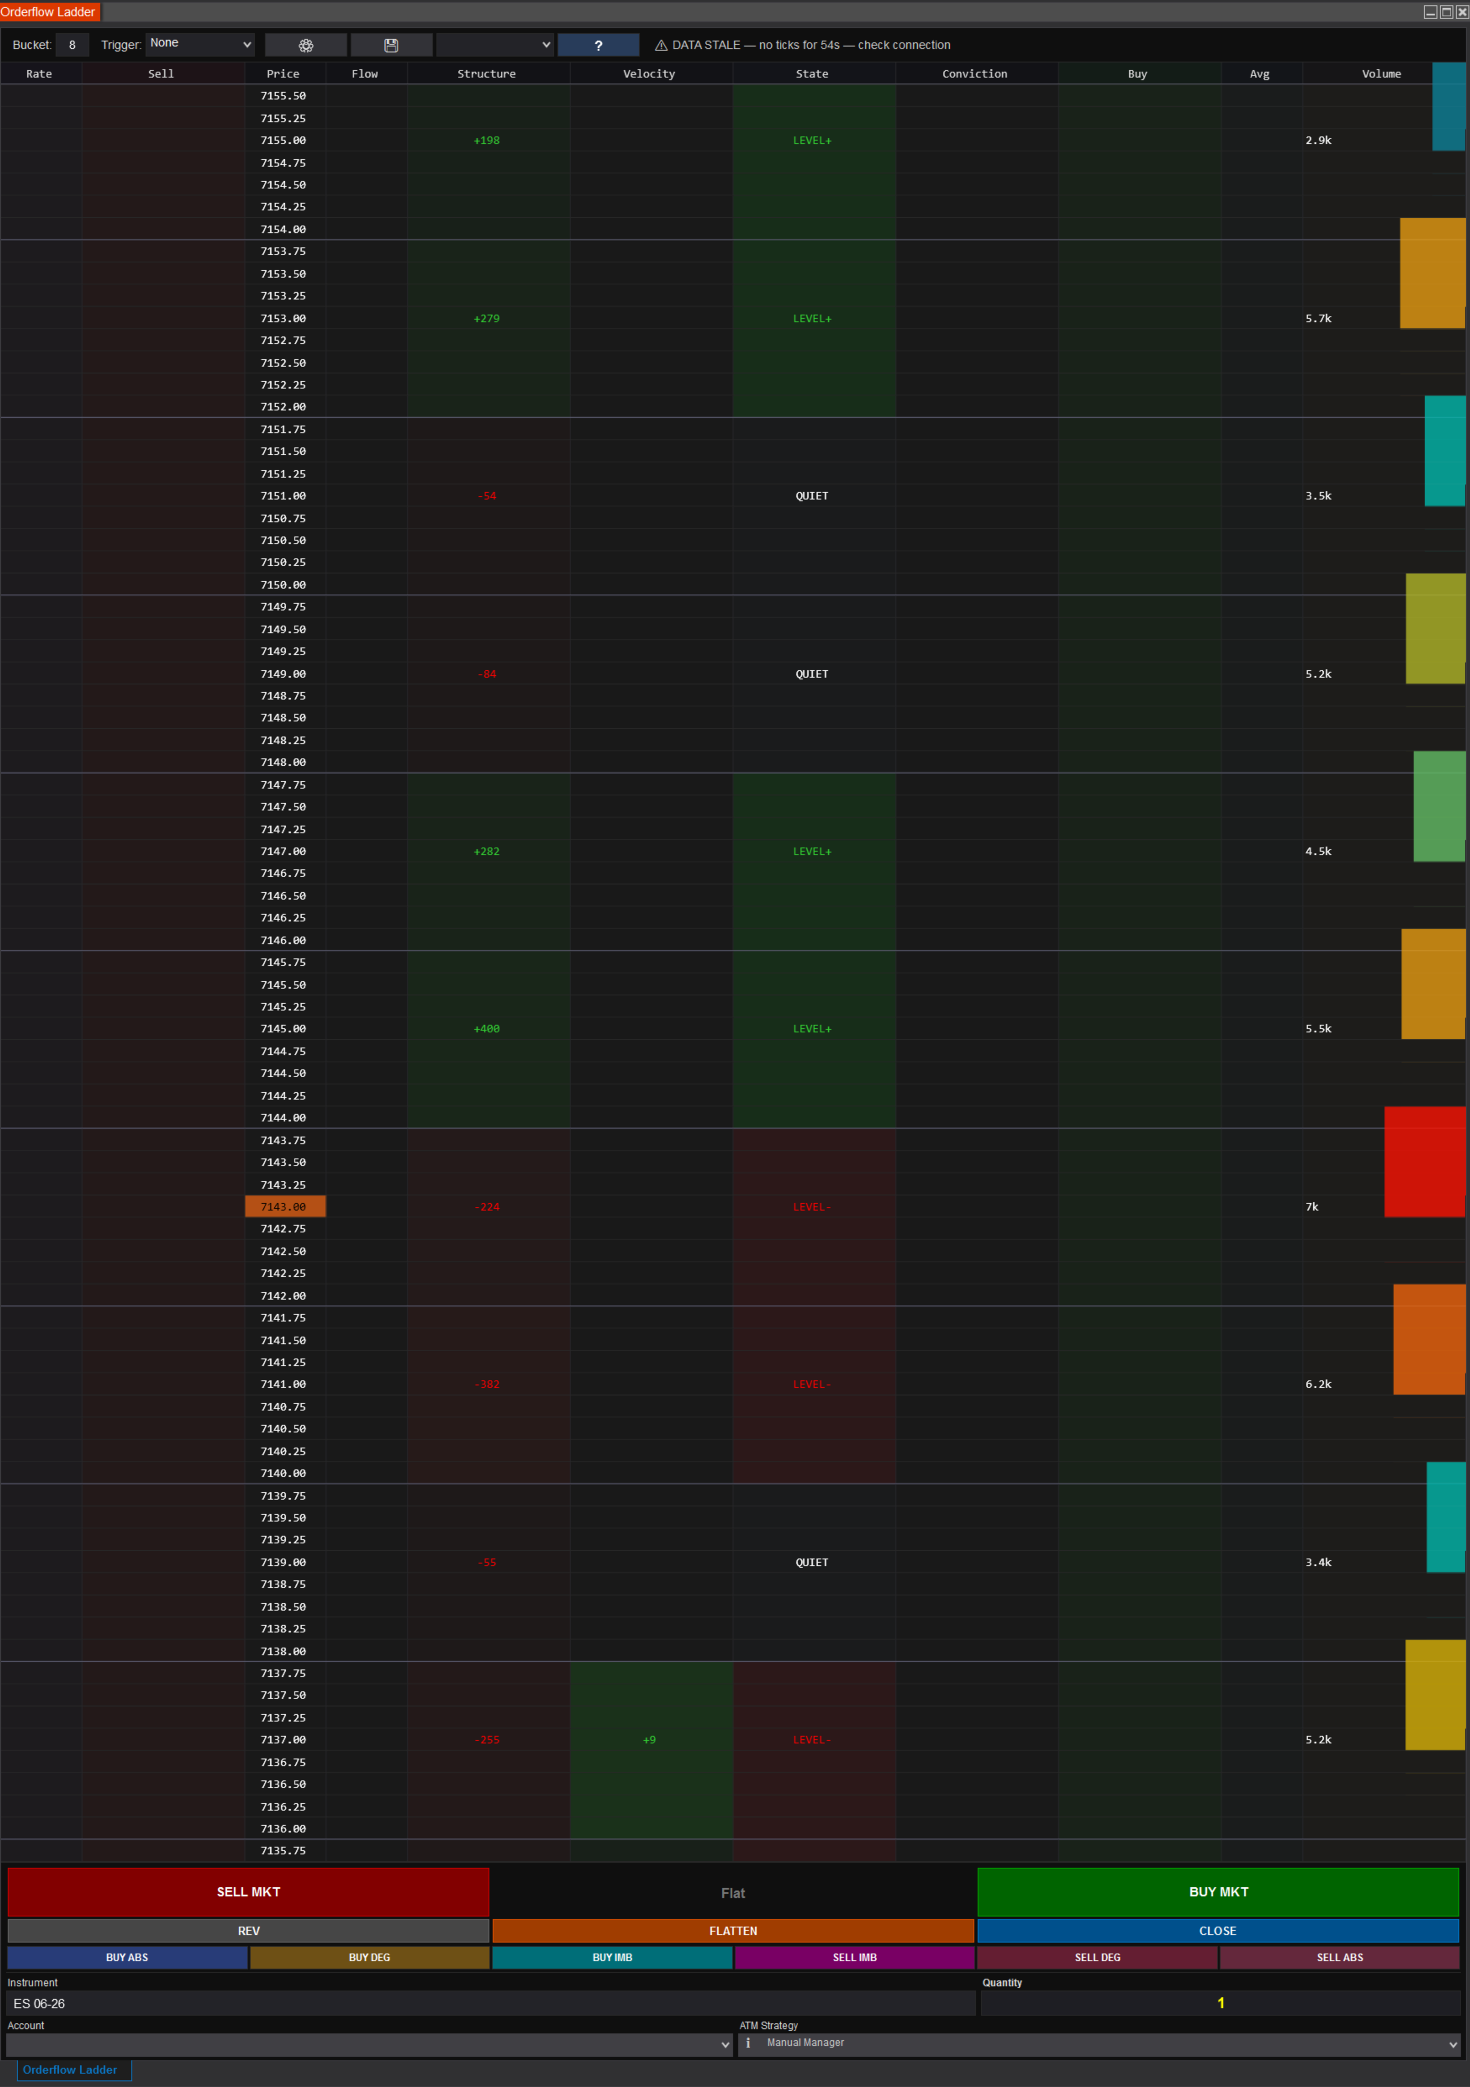
Lets build a standalone NinjaTrader 8 AddOn window that provides a fixed price orderflow ladder with structural classification, volume profile heat mapping, diagonal imbalance detection, and integrated order management. Use the AddOnBase to NTWindow to NTTabPage architecture with workspace persistence. The grid should use a one tick BarsRequest for session seeding and live streaming, a daily BarsRequest for prior day close, and a MarketData subscription for fallback values. Store per price state in a locked dictionary with a configurable sliding window. Columns should display tape rate, session and window sell/buy volumes, price, window delta, session cumulative delta, velocity as the derivative of session delta, a structural classifier, conviction percentage, and a session volume histogram with a heat gradient.

The classifier should distinguish between absorption where two sided volume defends a structural edge, degradation where one sided flow erodes the edge with velocity confirmation, exhaustion where the same attack happens but velocity does not confirm meaning the attack is failing, sweeping as extreme aggression, alignment where flow reinforces the edge, and quiet or level states for inactive prices. Diagonal imbalance compares buy volume at one price against sell volume at the adjacent price using dual thresholds. Session reference levels should include POC, Value Area, Session High and Low, Prior Close, Session Open, and Initial Balance.**

Order management should provide multiple order types through mouse actions on the buy and sell columns including limit, market if touched, stop limit, and stop market. Include select and move for existing orders, right click cancellation, and position management buttons for close, reverse, and flatten. Add a conditional trigger system that monitors for specific structural classifier states at designated prices before submitting orders. Performance should use WPF DrawingContext with dirty flag rendering, adaptive timer intervals, cached FormattedText, frozen brushes and pens, and a snapshot under lock pattern. Always search NinjaTrader developer documentation and forums before implementing BarsRequest patterns, order management, or WPF rendering. Do not rely on training data alone for NT8 API behavior.


The key thing with Claude and all AI is ‘context building’

2 Likes

Interesting. What were your follow up prompts. I’m sure Claude needed clarification on what ‘structural edge’, ‘erosion’, 'absorption, ‘velocity thresholds’, data structures, threading, file structure are supposed to be.

2 Likes

You can have a high-level, artificial intelligence model the behavior for absorption. And then as a human being when you look at that model, you can say yes this is about the best that I could model it based on my understanding of the participant interaction.

Again, it can build anything, but you have to understand specifically what you are building and what you want. It can accelerate the building of things by its ability to develop the mathematical derivatives of the behaviors that you’re looking for. But you again I keep mentioning the human being. You have to already know what you’re looking for, and be able to assess the model it puts out, as simple as it is, these models are not complex or rocket science, but you as a human need to be able to assess the model and say OK this is viable.

I didn’t give it explicit information as to what absorption means or what degradation means or what velocity means. Now I’ve spent years behind the chart looking at price movement,

The AI has consumed the corpus of literature on what absorption means or degradation or whatever else, and then I can tell it, search the Internet again to update your ‘mind’ with the most up-to-date information and then proceed (I would usually provide it with the Ninja Trader developer documentation, but I only did that the first time, it then knew where to go and locate it and find it, and all the other points on the Internet, where I can learn about what was necessary. It can scour the whole ninja Trader forum, in order to learn everything that had been discussed in the past.).
That’s how we built the actual add-on scaffolding. I told her to go to and consume the ninja script, documentation and Ninja Trader developer documentation, in order to learn the best practices of how to accomplish X orY, and it does that. I give it instruction and it executes

Your follow up questions will be based on what you’re looking for, and the direction that you want to take the build.

I think actually interacting with these artificial intelligence tools, and just talking to it with the objective of building something it will be a good start. The process helps you to understand how you can interact with it, what biases you have in interacting with a model like this, and then you can test it, and see if it overcome those biases. Because when I first started using these stools, I had biases as to oh this is just a simple calculator doing statistical calculations to come up with the next word, but the more I used it the more I saw that it can hold an idea, over a long context session and continually build upon a tool in the same way that you and I might mold a pot of clay.

How do you verify that what AI claims had done is actually done. In my experience AI makes mistakes with great confidence. Once time it wrote an indicator and in the process of fixing it - removed secondary data series while still claiming it’s there.

Basically, I am interested if you have a system on keeping taps on changes and perhaps structural rigor that lowers number of hallucinations and unwanted changes.

Good question, use claude for the actual build. And then ask it to give you a human scale model of what it built so that you can interrogate yourself with your mind. Now with calculations like modeling absorption, degradation, etc, you have to yourself have to be able to comprehend the relationship that forms absorption.

It’s the same way that if some stranger told you what absorption was, and you were an illiterate, you would just believe them because you had no idea what absorption is, and whatever someone tells you you’d believe, however, if you have a mind to know what absorption is, and someone tells you wrongly what absorption is, you can say that’s not right and then you can correct the person.

Now the artificial intelligence tool can tell you all sorts of things, but as you said, it can sometimes give you information that is not adapted to the objective, and so you have to assess that information, and redirect it or correct it.

Here’s a tip: Here’s one of my workflows, after Claude builds a tool, or develops a model for me, I can look at it with my mind and say OK this is viable, but then I can take it to another high-level artificial intelligence model like ChatGPT 5.5, and ChatGPT 5.5 looks at different vector points, and finds different other things, and can enhance or correct the knowledge that was used to build a tool that I might’ve built in Claude. So I use another very high-level artificial intelligence to check the work of claude. The best combination for me has been ChatGPT at the highest level, and Claude at the highest level.

1 Like

These are some best starting best practices:

@Maverick and @MannyVill thanks for the inspiration (and code). I’m not sure I’ll ever finish but so far it’s been pretty smooth sailing.

DOM Ladder

1 Like

That look great, great job on that

1 Like

Congratulations!

And the good thing about this is that it’s all yours. You’re not paying a monthly fee, and you can create anything you want exactly as you wanted, to help you see an interact with the market better. How does it feel?

You have a unique feature in this tool that I haven’t seen anywhere, which is that sliding element. And it came from your mind and you just constructed it. Wow!

Thanks. I need the mouse hover marker because each cell is only two pixels tall. That way I can have tick accuracy and fit 170 points of NQ w/o scrolling. Plus, I can show DOM levels in any chart window:

HoverLine

2 Likes

That’s really cool. Very very useful.

I don’t know if you’re a software person (I wasn’t), but since you were asking about Claude, you’re kinda like me. I’m curious to know how you feel having created something as useful and unique as this. (Because you can’t find this yet on the market)