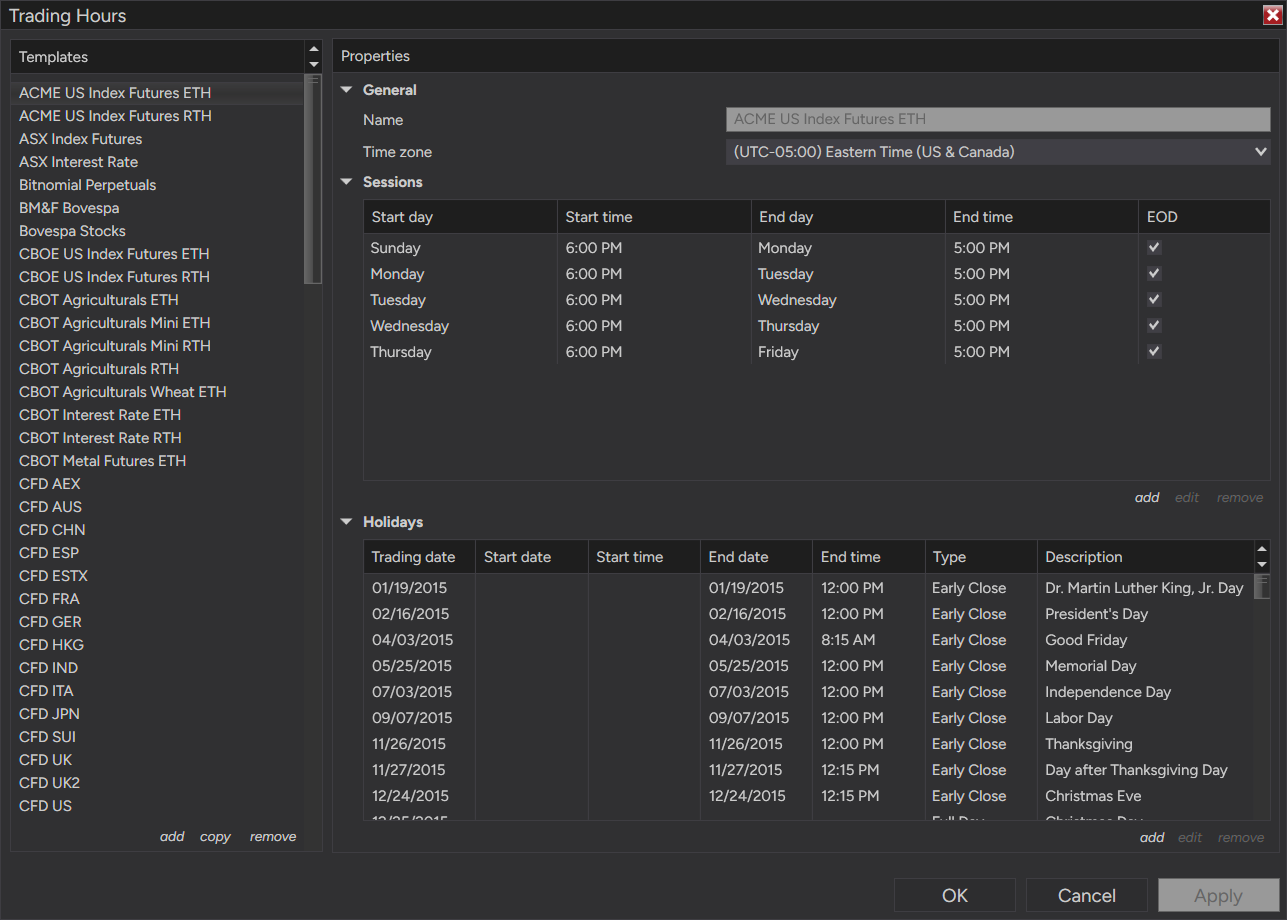
When using volumetric data series (footprint) charts and applying the cumulative delta stats grid all it displays is green even when market is downtrending. I have properly adjusted trading hours template so it resets daily which works but all it does is go up always green display. Tried turning tick replay on/off, reconnecting accounts and total reset of platform to start from scratch but never works to show both green and red cumulative delta. The weird part is this happens with ES charts but when switching to MES or vice-versa it displays correctly. Tried all kinds of setting tweaks and never works right. Please help.
Since ES and MES behave differently with what sounds like the same chart configuration, I would try to isolate whether the problem is in the delta display or in the underlying bid/ask classification.
One useful test is to open ES and MES side by side with the same Trading Hours template and the same Cumulative Delta settings, then compare a short completed period using both:
Bid AskdeltaUp Down Tickdelta
If ES behaves incorrectly only in Bid Ask mode while Up Down Tick looks reasonable, that would point more toward the bid/ask-stamped input or trade classification than toward the session reset or chart coloring.
I would also check the actual numerical cumulative-delta values rather than only the green/red presentation. A falling market does not necessarily require cumulative delta to be negative, but the delta series itself should be capable of decreasing as sell volume accumulates.
Since MES is behaving correctly, keeping both charts on the same connection and logging a small sample of Last/Bid/Ask updates around the same time could be a useful next step. That would help determine whether ES is receiving/classifying the stream differently before doing another platform reset.
The problem is with Bid and Ask and not an indicator but the actual chart option to use cumulative delta under statistics. You see how ES runs greener the further it gets from open while MES does opposite. Now unsure which is the wrong one, both using same settings and time template is only adjusted to my time zone by one hour up.
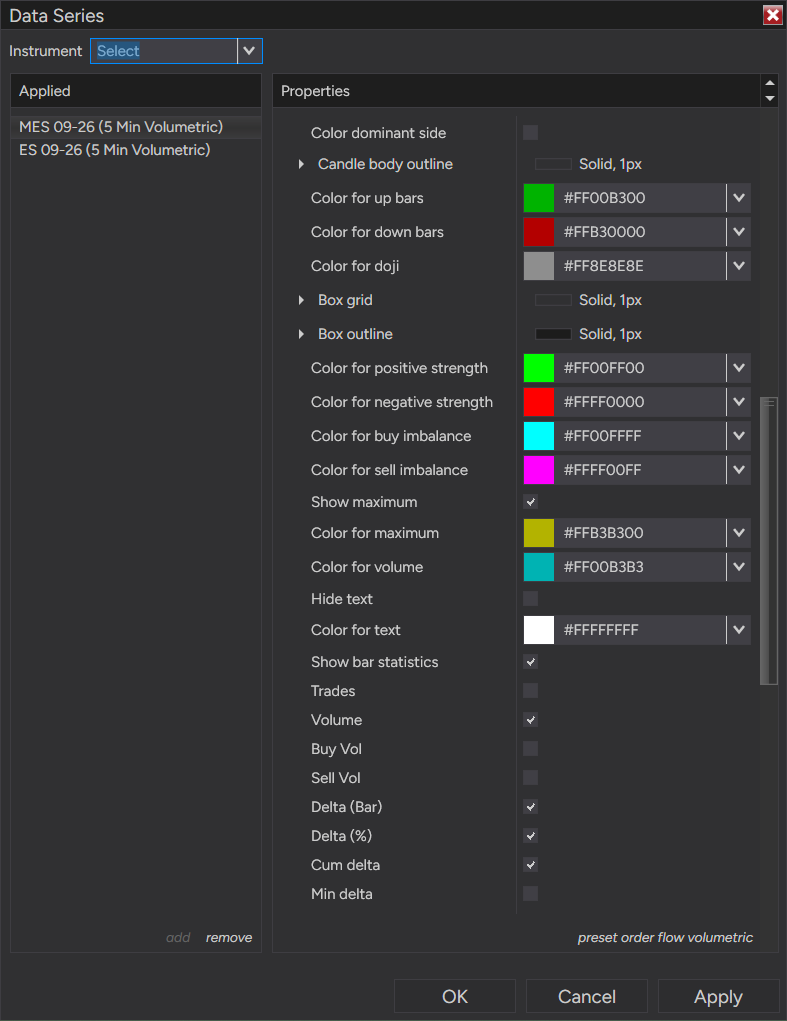
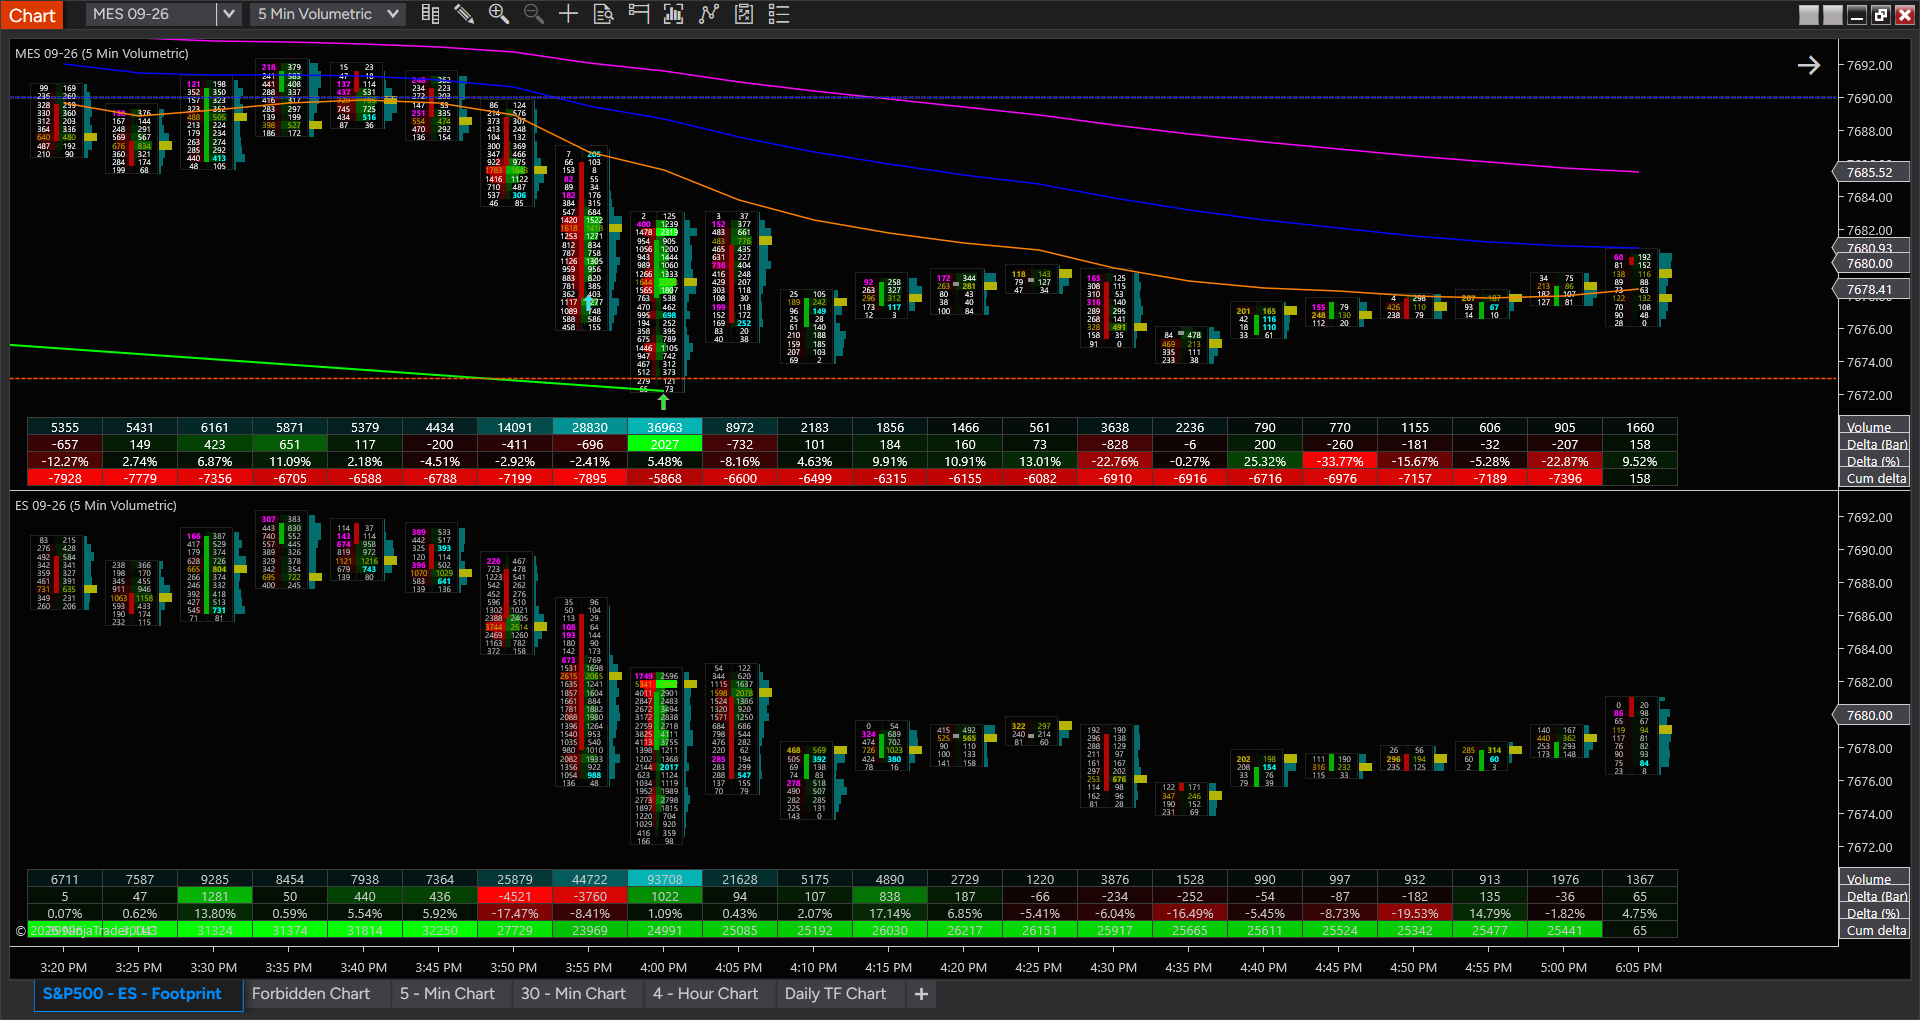
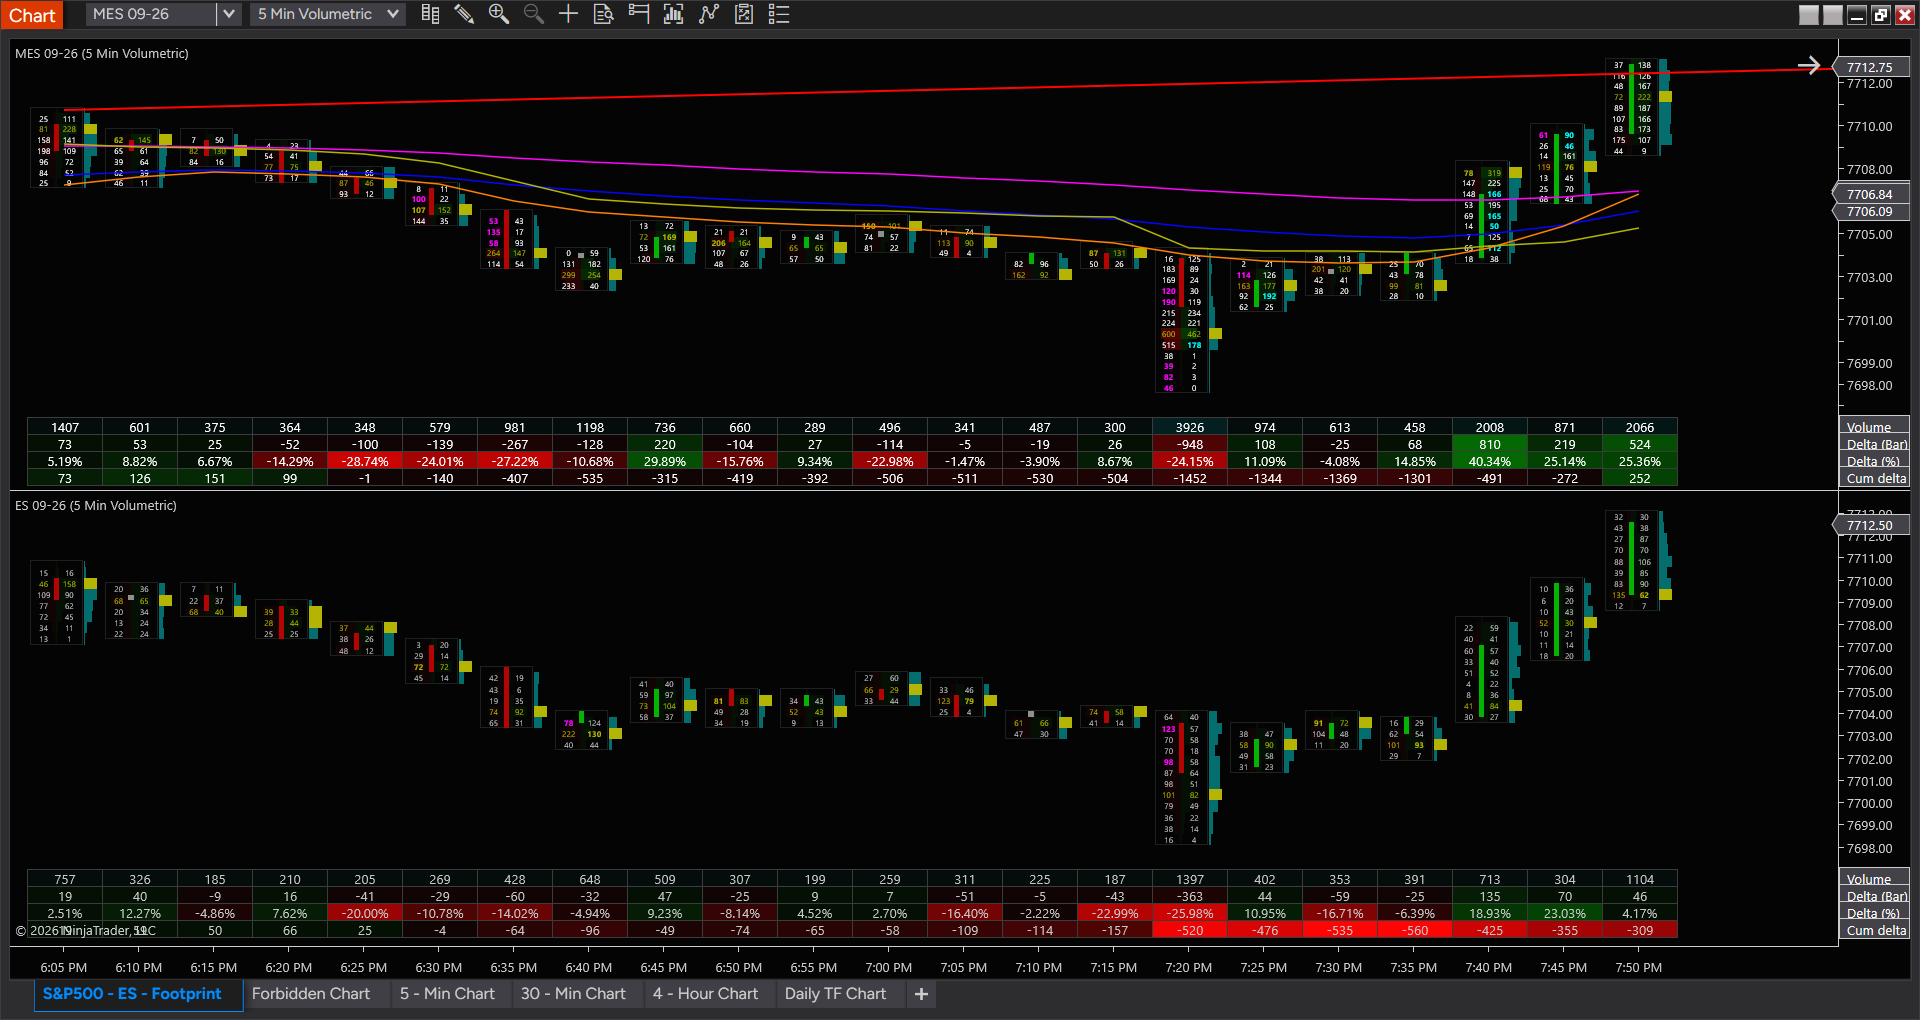
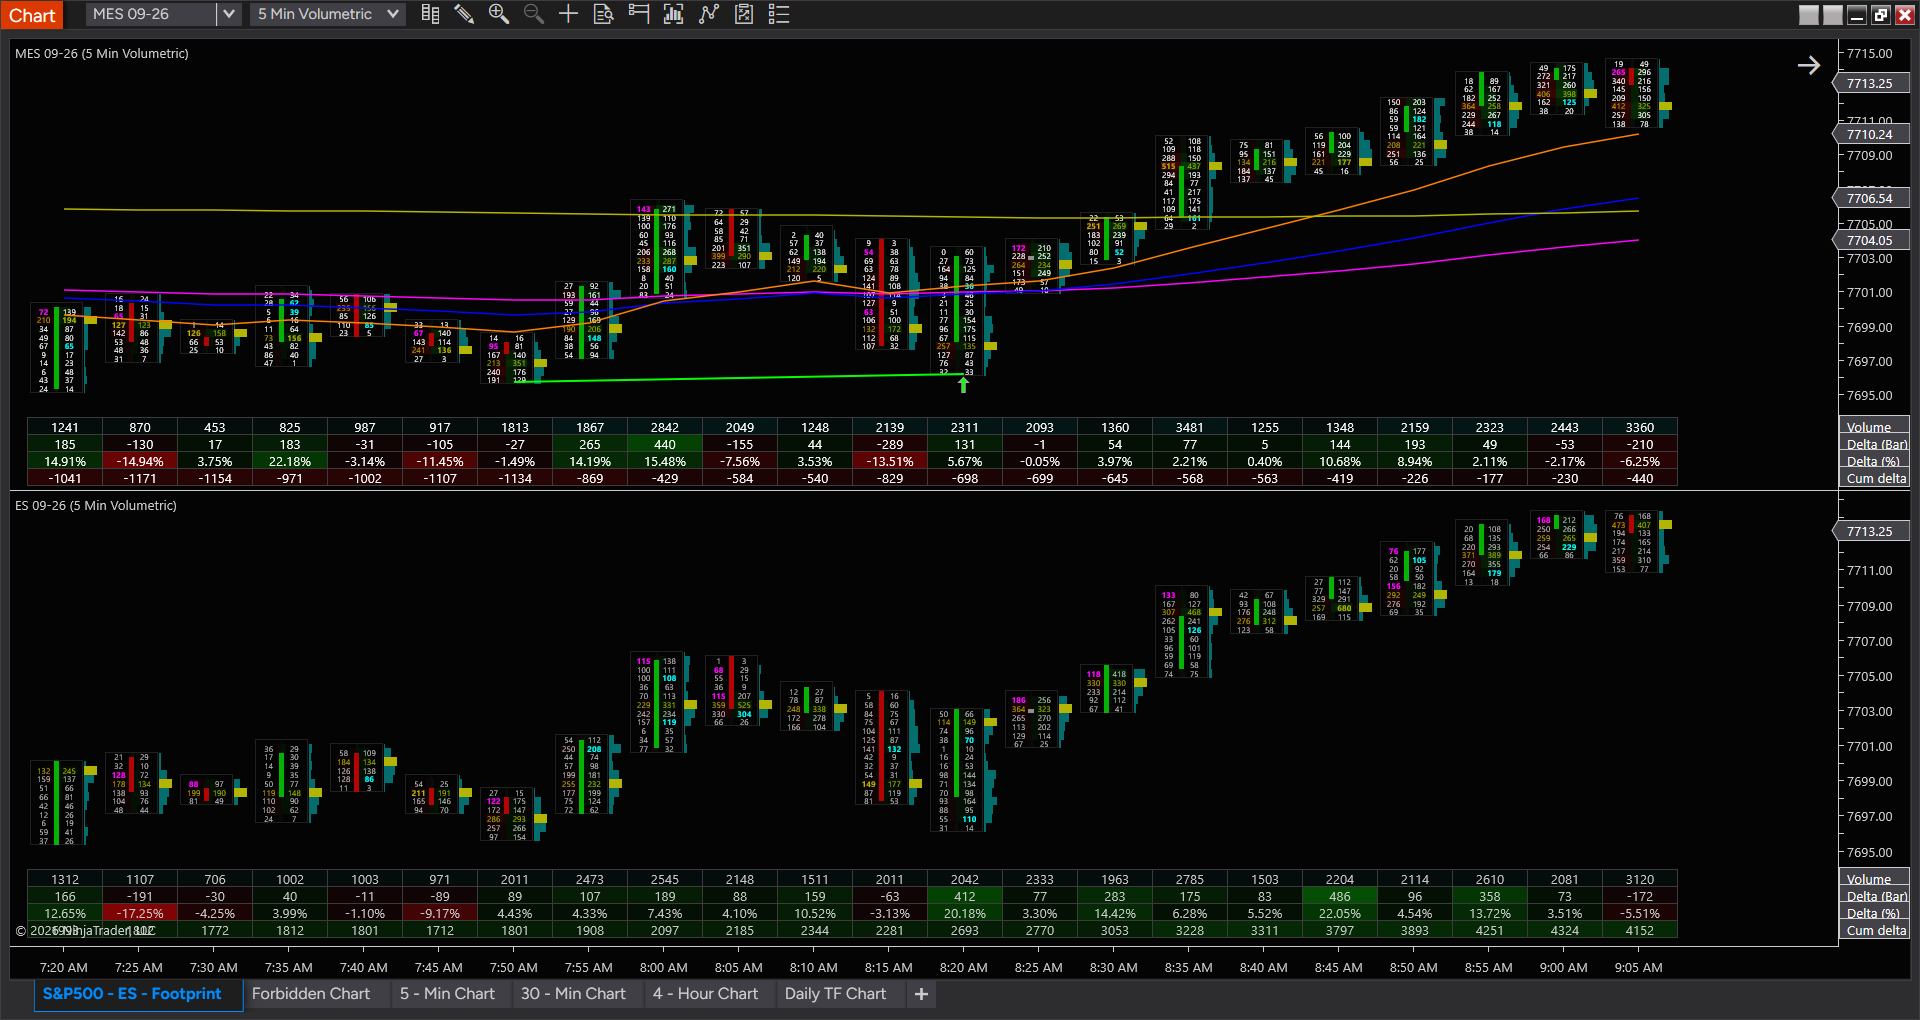
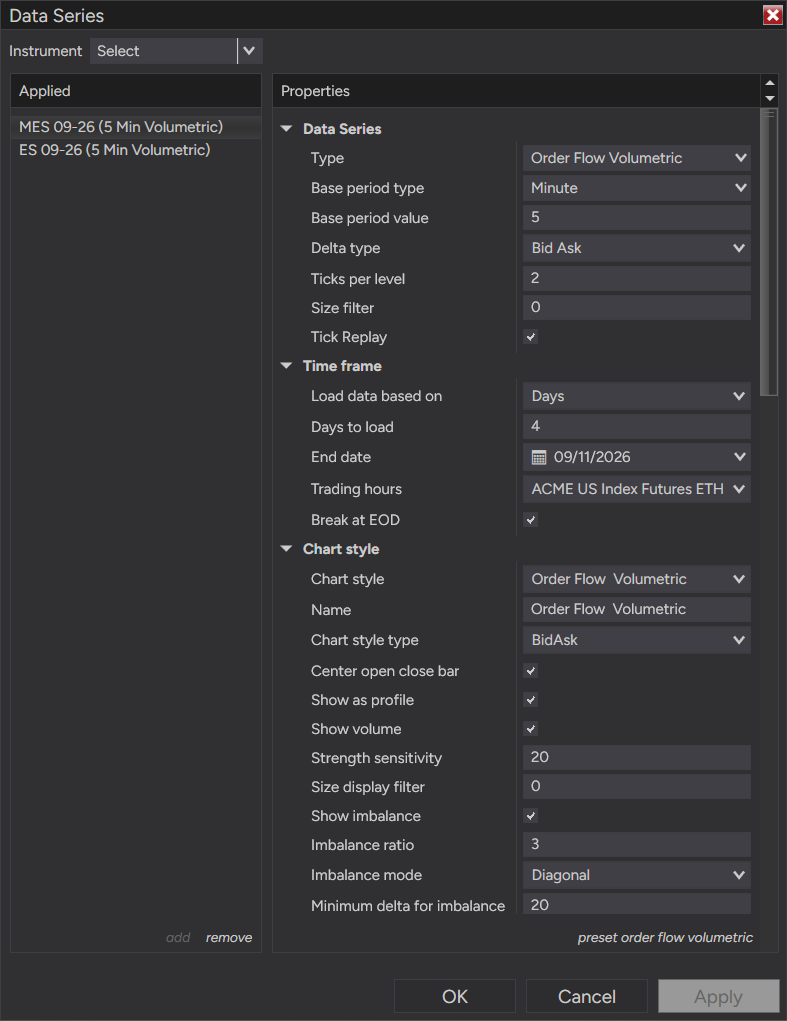
Thanks, that clarification helps. If you mean the Cumulative Delta field in the Volumetric Bar Statistics grid, then I would not assume that either ES or MES is wrong just because the two move in opposite directions.
ES and MES are separate order books. Their Bid/Ask delta is calculated from the trades occurring at the bid versus ask on each instrument, so price direction can look similar while the cumulative delta develops differently.
I think the cleanest test now is to stop comparing the color first and compare the actual underlying statistics over the same short session window.
On both ES and MES, record:
- Buy Vol
- Sell Vol
- Delta (bar)
- Cumulative Delta
for maybe 5–10 completed Volumetric bars.
For each bar, Buy Vol - Sell Vol should agree with that bar’s Delta, and the session Cumulative Delta should progress from those bar deltas.
If those arithmetic relationships are internally correct on both instruments, then the ES/MES divergence may simply be genuine order-flow divergence rather than a display problem.
If ES shows numbers that do not reconcile — for example the bar delta does not correspond to Buy Vol minus Sell Vol, or cumulative delta changes inconsistently with the bar deltas — then you have a much stronger reproducible case.
I would also keep both charts on the exact same session template and compare the same contract month while doing the test. The one-hour timezone adjustment should not by itself make one instrument accumulate only positive delta if the session boundaries are otherwise equivalent.